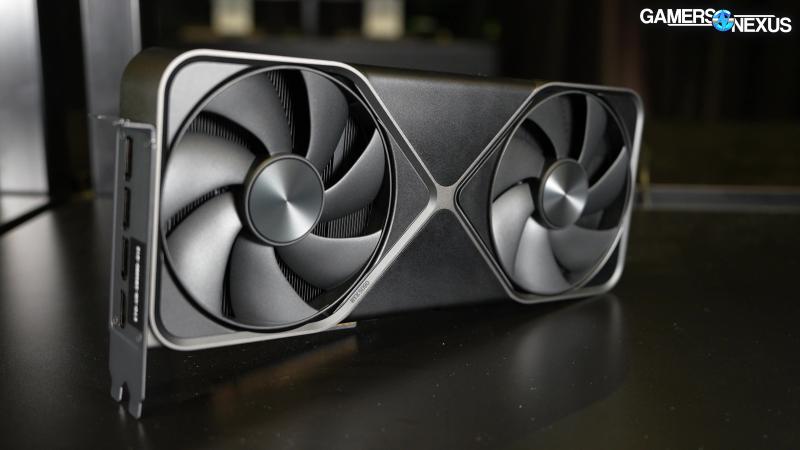
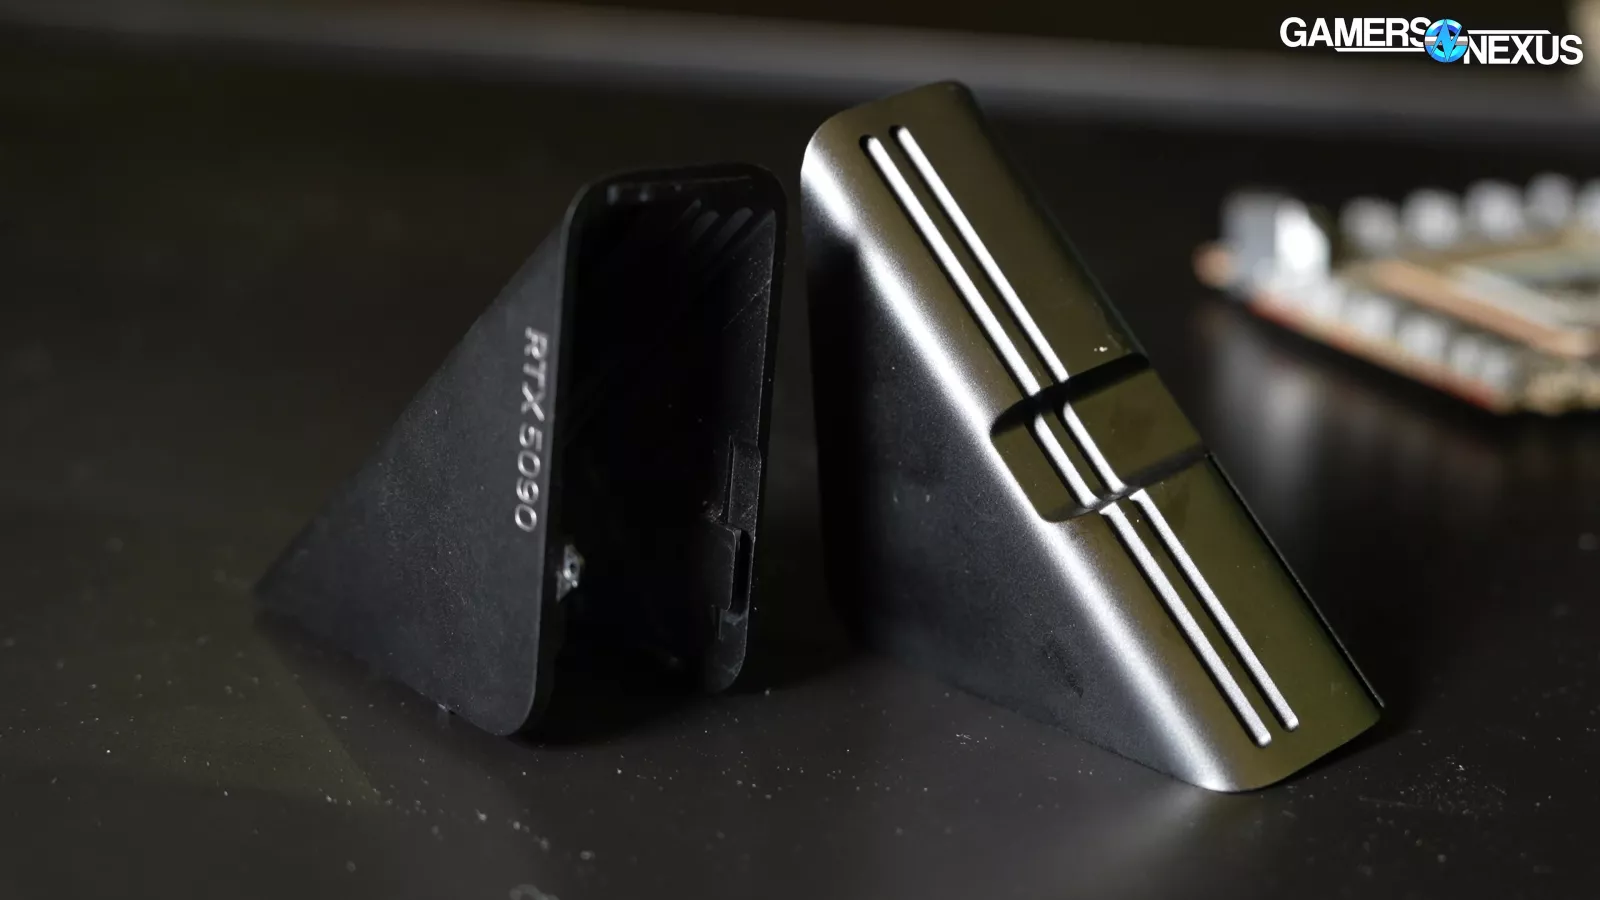
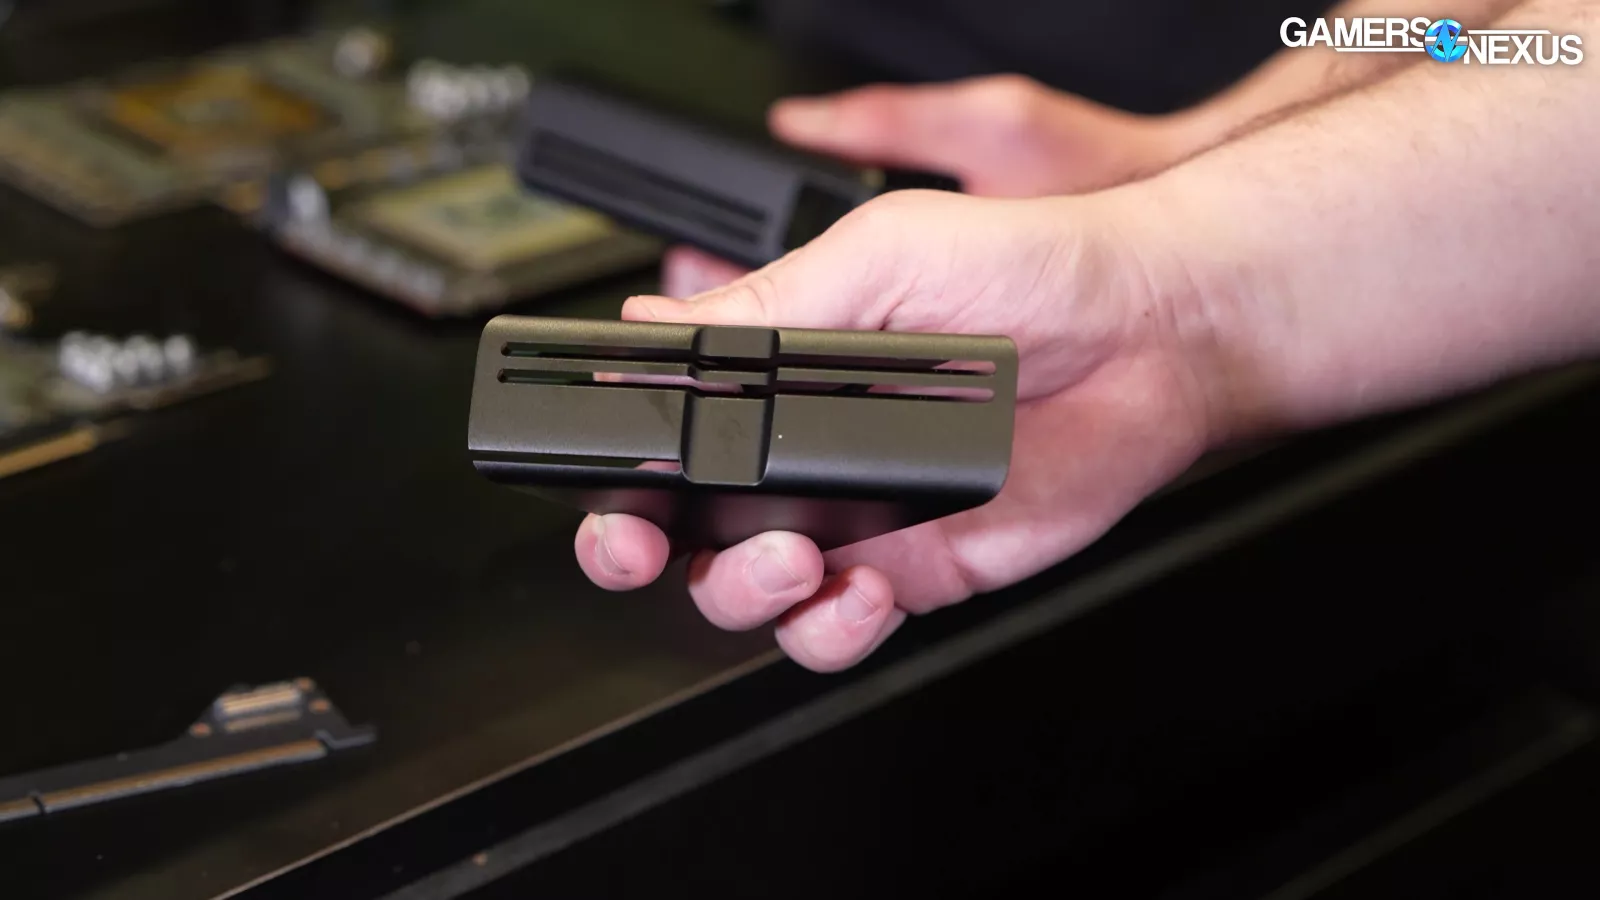
First off, we have a huge amount of content related to this card coming up since the Founders Edition model is so unique. Make sure you check back regularly over the next few days to catch our benchmarks in common mini-ITX cases, the impact of the GPU on CPU and CPU cooler thermals, and some other tests. We also have a tear-down coming up.
Normally, these Founders Edition models don’t warrant a ton of discussion. This one does, but we’ll keep it short.
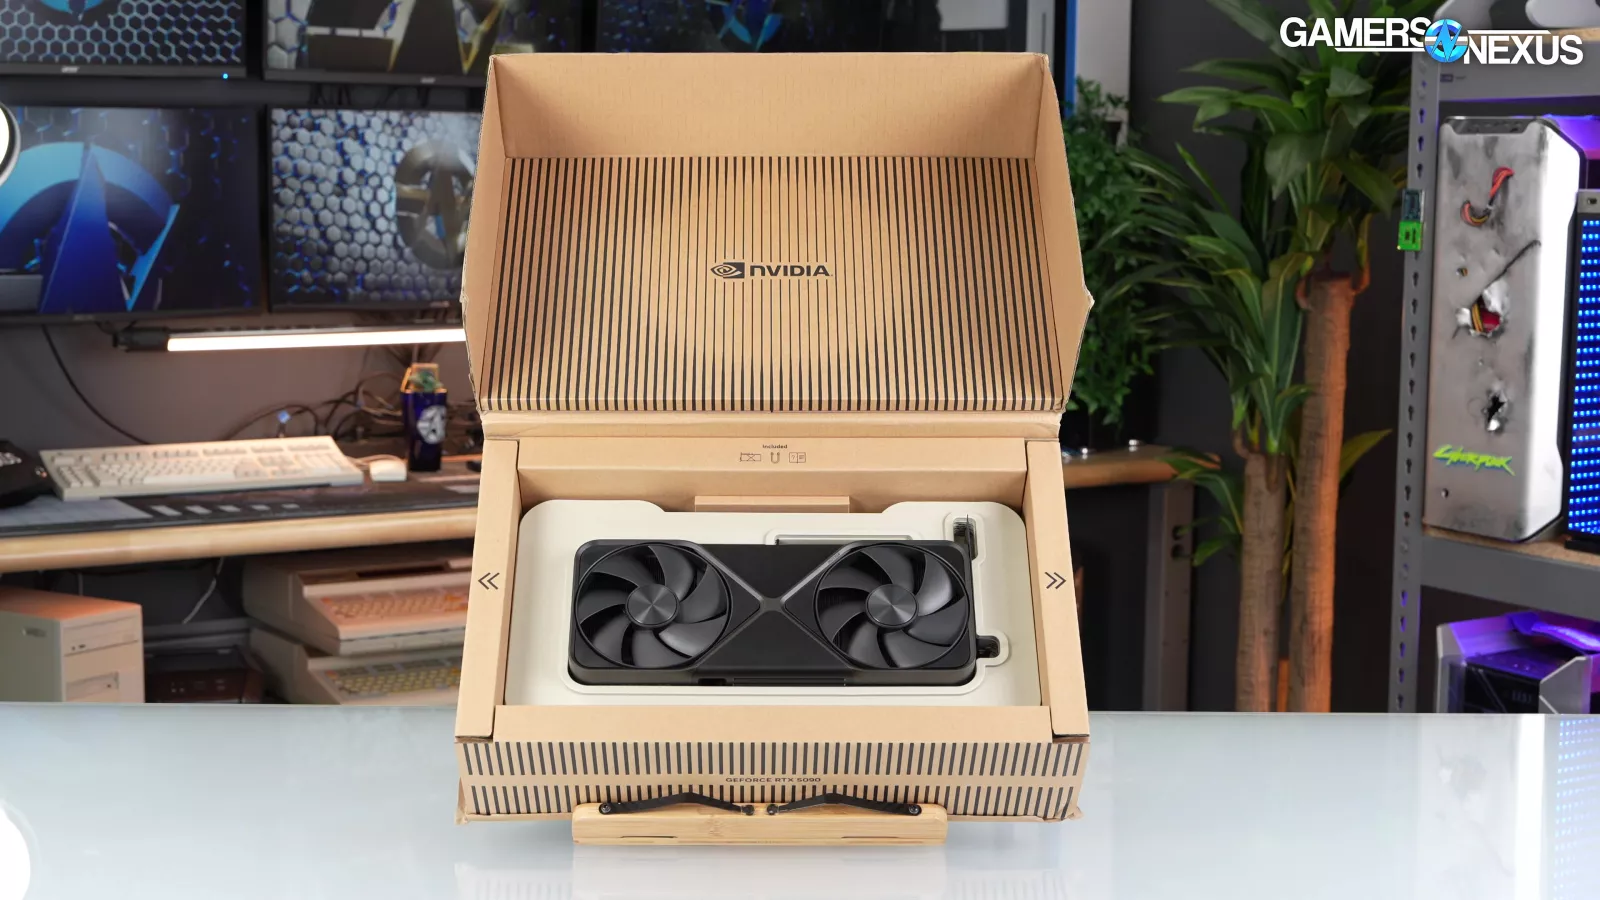
The RTX 5090 Founders Edition moves to a 2-slot design and uses a dual flow-through configuration, so they’ve sandwiched the PCB centrally and offset the PCIe slot to the side and down as a result. That also means that NVIDIA needs a separate PCB for the I/O that feeds monitors, connected via a flex cable to the main PCB. To get a 2-slot cooler capable of handling 575W or more, NVIDIA is using liquid metal with a triple-walled gasket to both contain the liquid metal and prevent exposure that could change its consistency and efficacy.
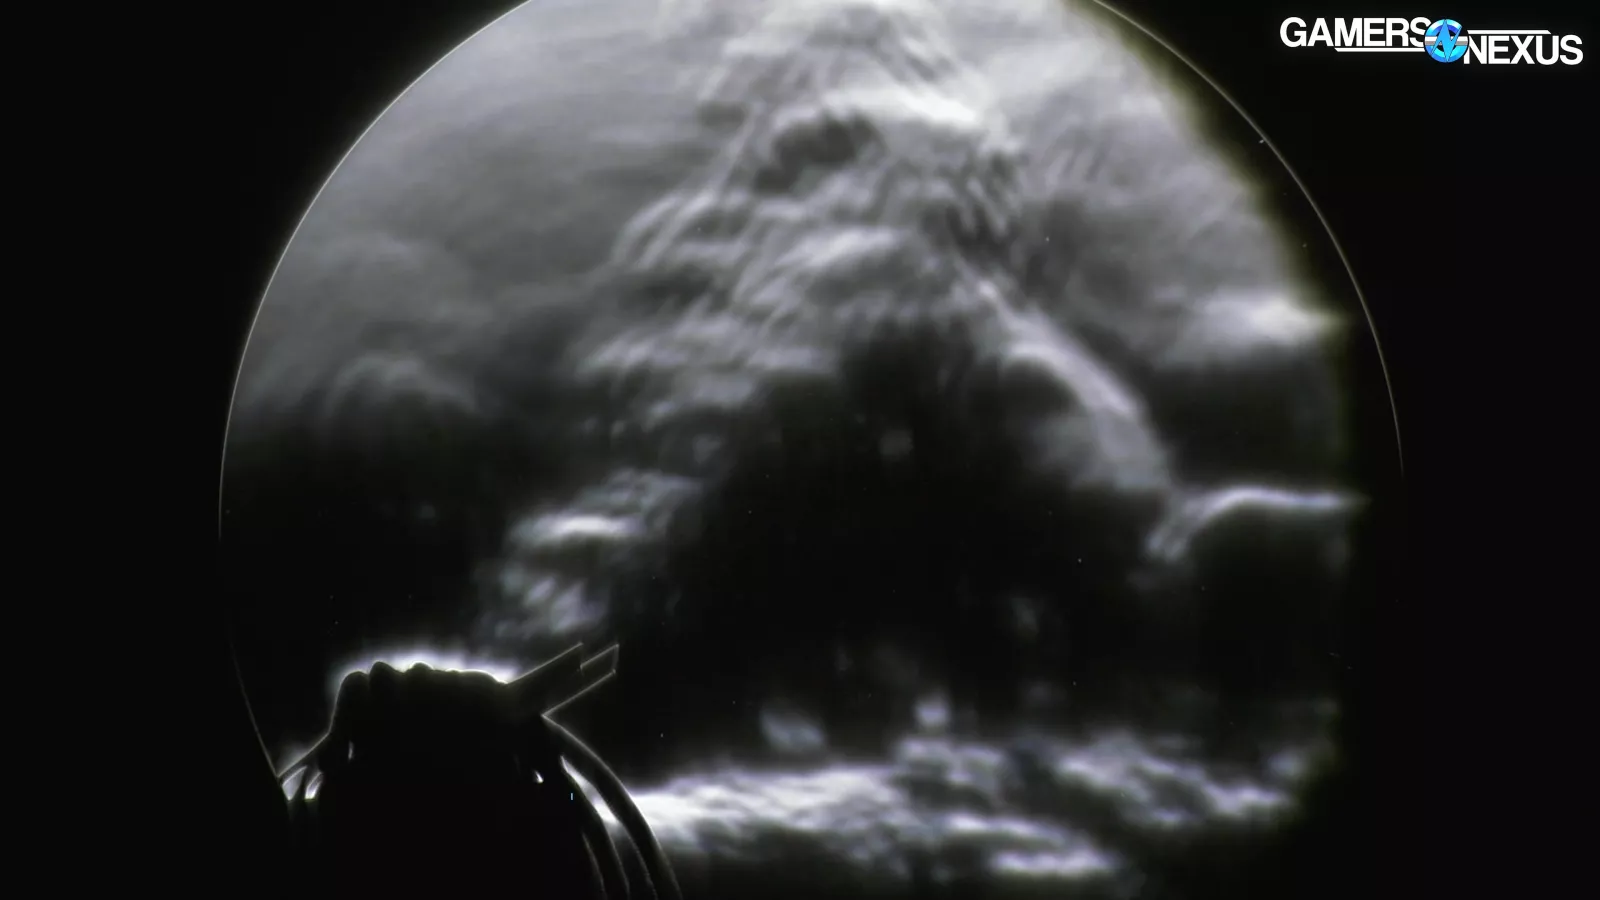
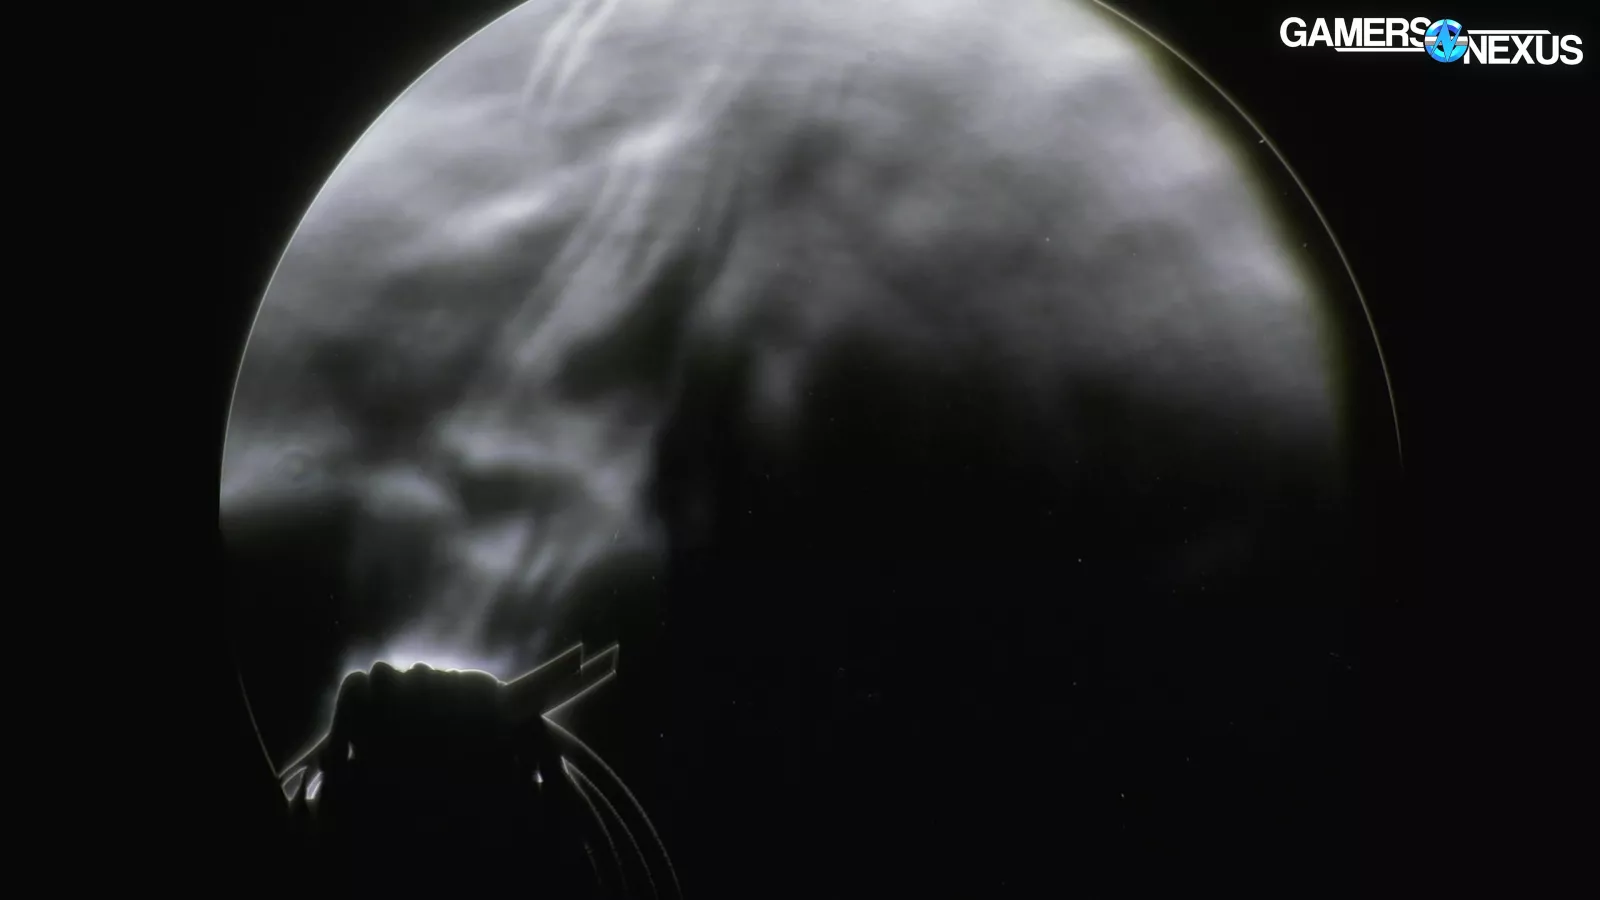
The FE model does a lot of small things to improve performance, like exhausting the air out the top of the card and away from the GPU inlet. You’ll see that in our Schlieren imaging below.
We have a full video with Malcolm Gutenberg, Lead Thermal Engineer on the FE card, breaking down the changes.
RTX 5090 Pricing
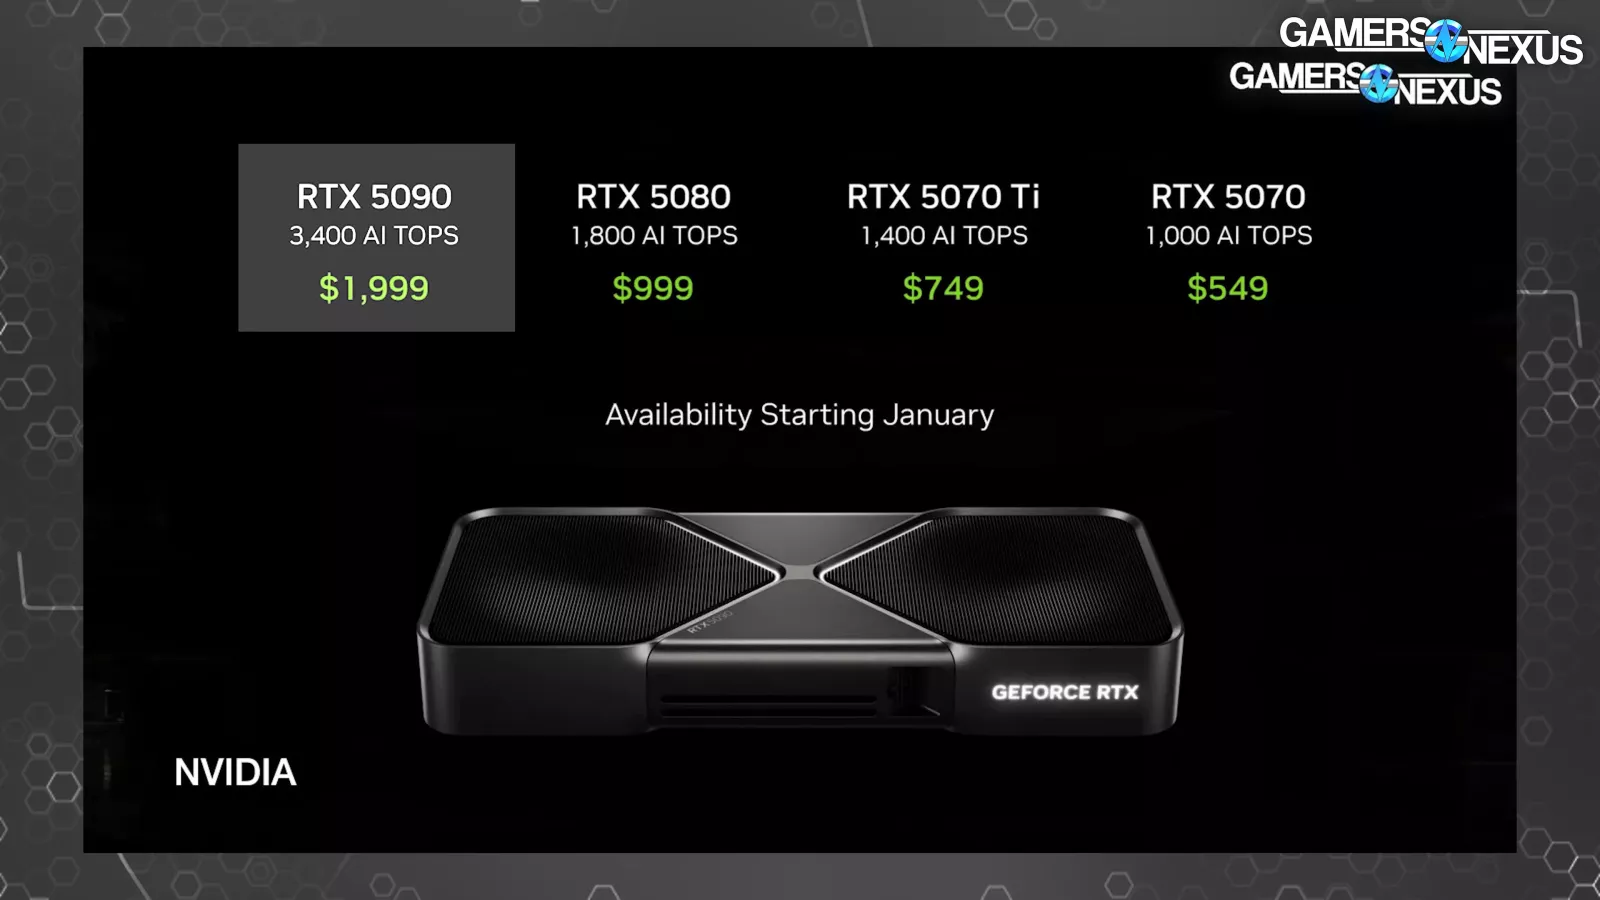
The NVIDIA RTX 5090 is supposed to be $2,000 and will have official availability on January 30th, joined by the $1,000 MSRP RTX 5080 on the same date. NVIDIA also has the 5070 Ti and 5070 launching in presumably February for $750 and $550.
The NVIDIA RTX 4090 had an MSRP of $1,600, then was regularly priced around $2,000-$2,500 due to shortages and demand, and is basically out of stock except at terrible third-party seller prices now. The RX 7900 XTX (watch our review) is AMD’s closest competitor. Pricing is around $870 to $900. The company has also bowed out of the high-end race. The 9070 and 9070 XT, AMD’s next cards, should be coming around March or so.
Intel is currently only fighting at the low-end and mid-range.
Which makes all of this somewhat weird, because there are no head-to-head competitors right now. The closest comparison is the RTX 4090, then maybe the RX 7900 XTX from AMD’s side.
RTX 5090 Overview
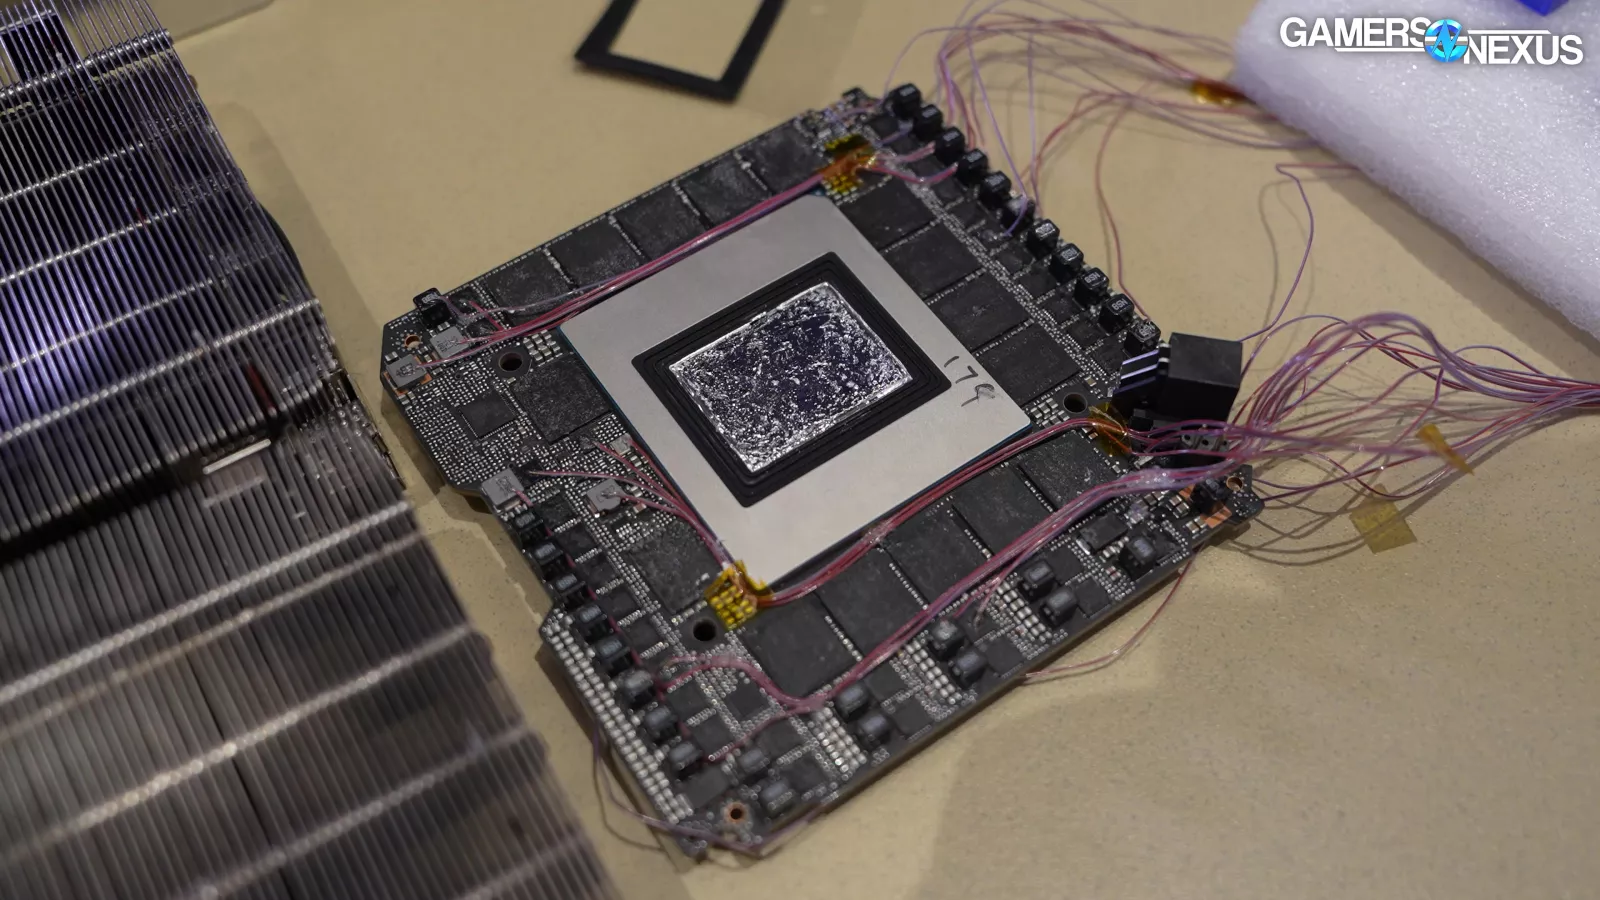
The RTX 5090 has 32GB of GDDR7 memory, which is a big change, and runs on the Blackwell architecture, which follows Ada Lovelace. It’s introduced alongside multi-frame generation (MFG) and DLSS4, which we’ll talk about later.
The 5090 is also a true PCIe Gen5 device, but that’ll be another separate piece soon to check back for the differences.
If you want to see our testing methodology, we’ve published the test bench and the list of games and their settings here, which will let you get quick answers to what we’re doing. It doesn’t have every answer, but we’re slowly adding to it with each review cycle.
RTX 5090 Thermals
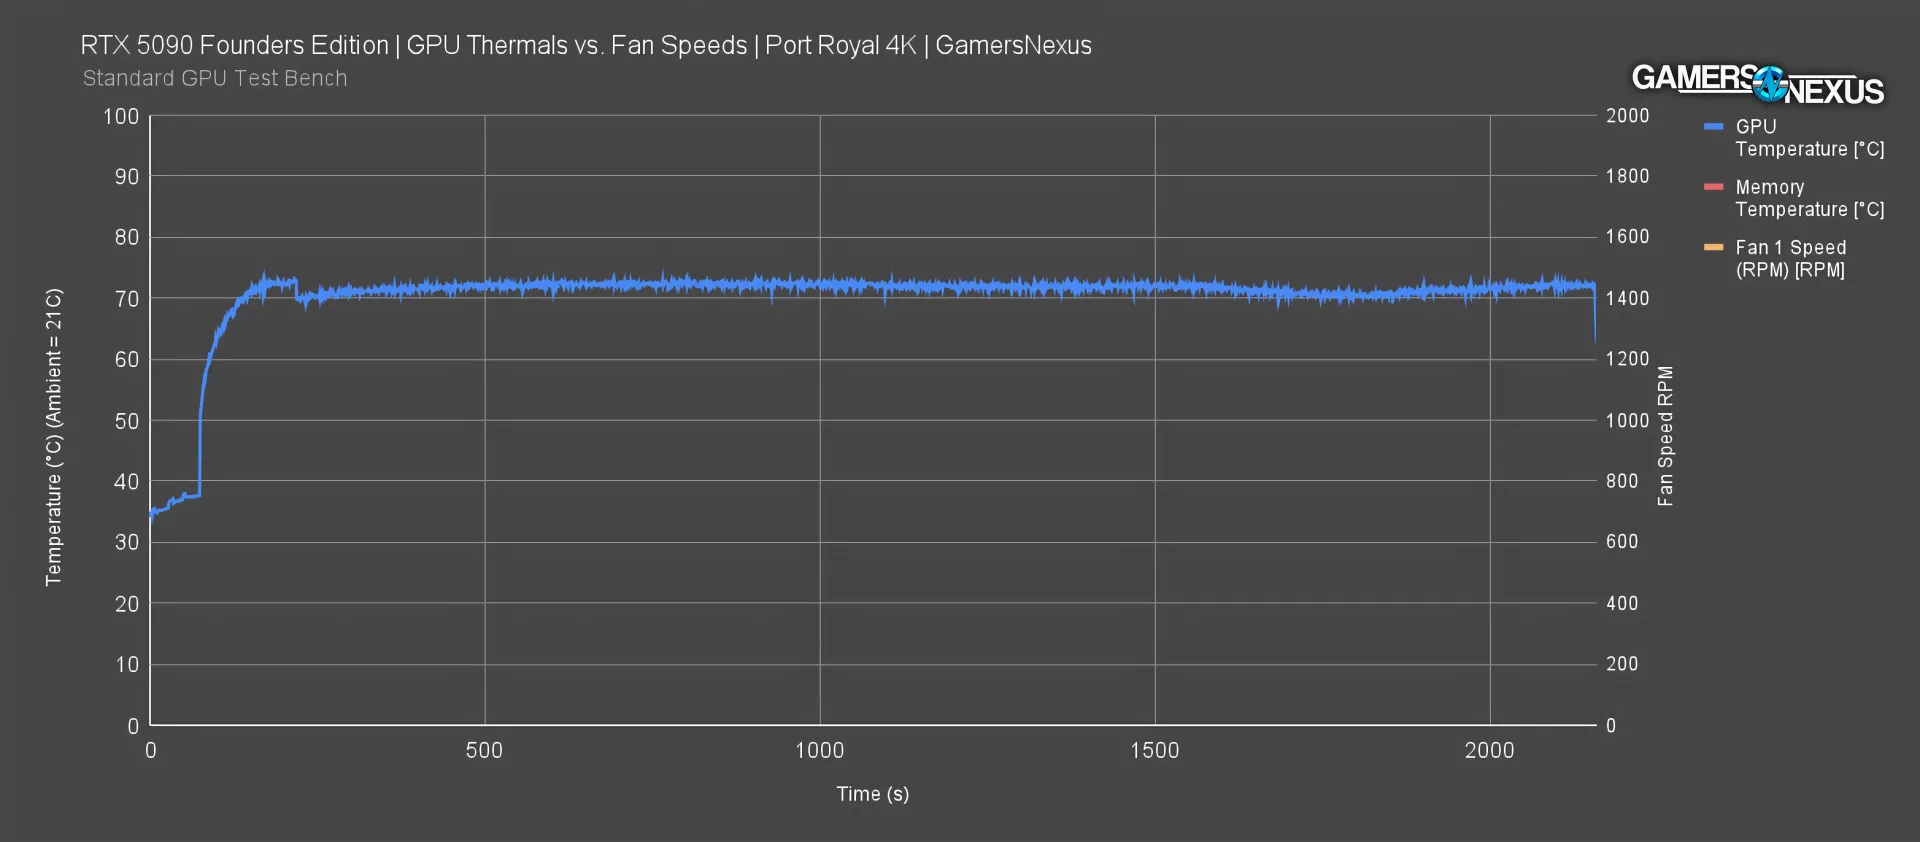
Here’s a thermal chart running the RTX 5090 under its auto VBIOS fan curve with a Port Royal RT stress test at 4K.
GPU temperature plots at about 72 degrees Celsius once it hits steady state for overall temperature when tested in a controlled room ambient of 21 to 22 degrees Celsius. This GPU temperature is genuinely impressive considering the size of the card, and that’s important to remember. At 2 slots versus that 4-slot monster we’ve seen for the last few years, this is an excellent result given the size. Our prototype testing already told us what NVIDIA can do with a fully committed, fatter design if you’re curious what that’d look like.
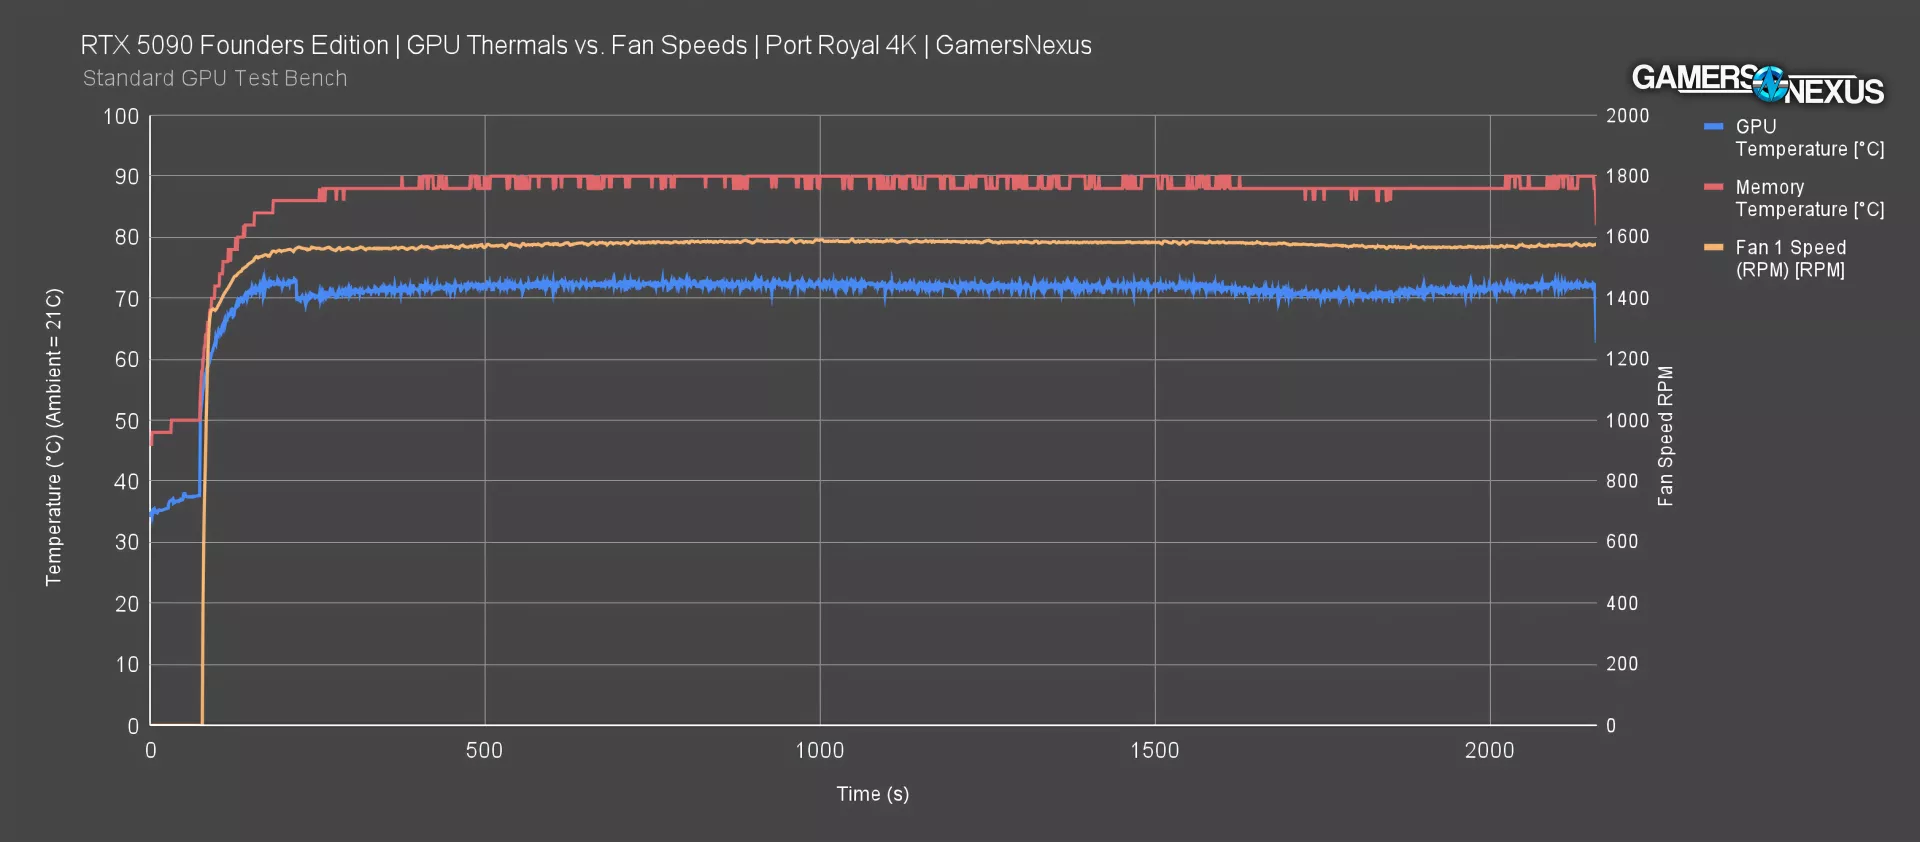
Memory temperature ran warm, unfortunately, at 89 to 90 degrees Celsius. This is higher than we’d like to see, especially considering it could be warmer in certain case configurations with a higher internal ambient temperature. This is technically still within the TjMax of these memory modules as far as we could find, so there isn’t an imminent threat to the card, but this would be an area for NVIDIA to improve; our primary concern is in hotbox cases or small form factor solutions, which we’re looking into as a follow up that you should check back regularly for. While these results are higher than what we’d like to see, in most high airflow ATX cases, it is okay.
Adding GPU fan speed to this chart, the fans both hit around 1570 RPM. We should get to acoustic testing for more on this.
RTX 5090 Acoustics
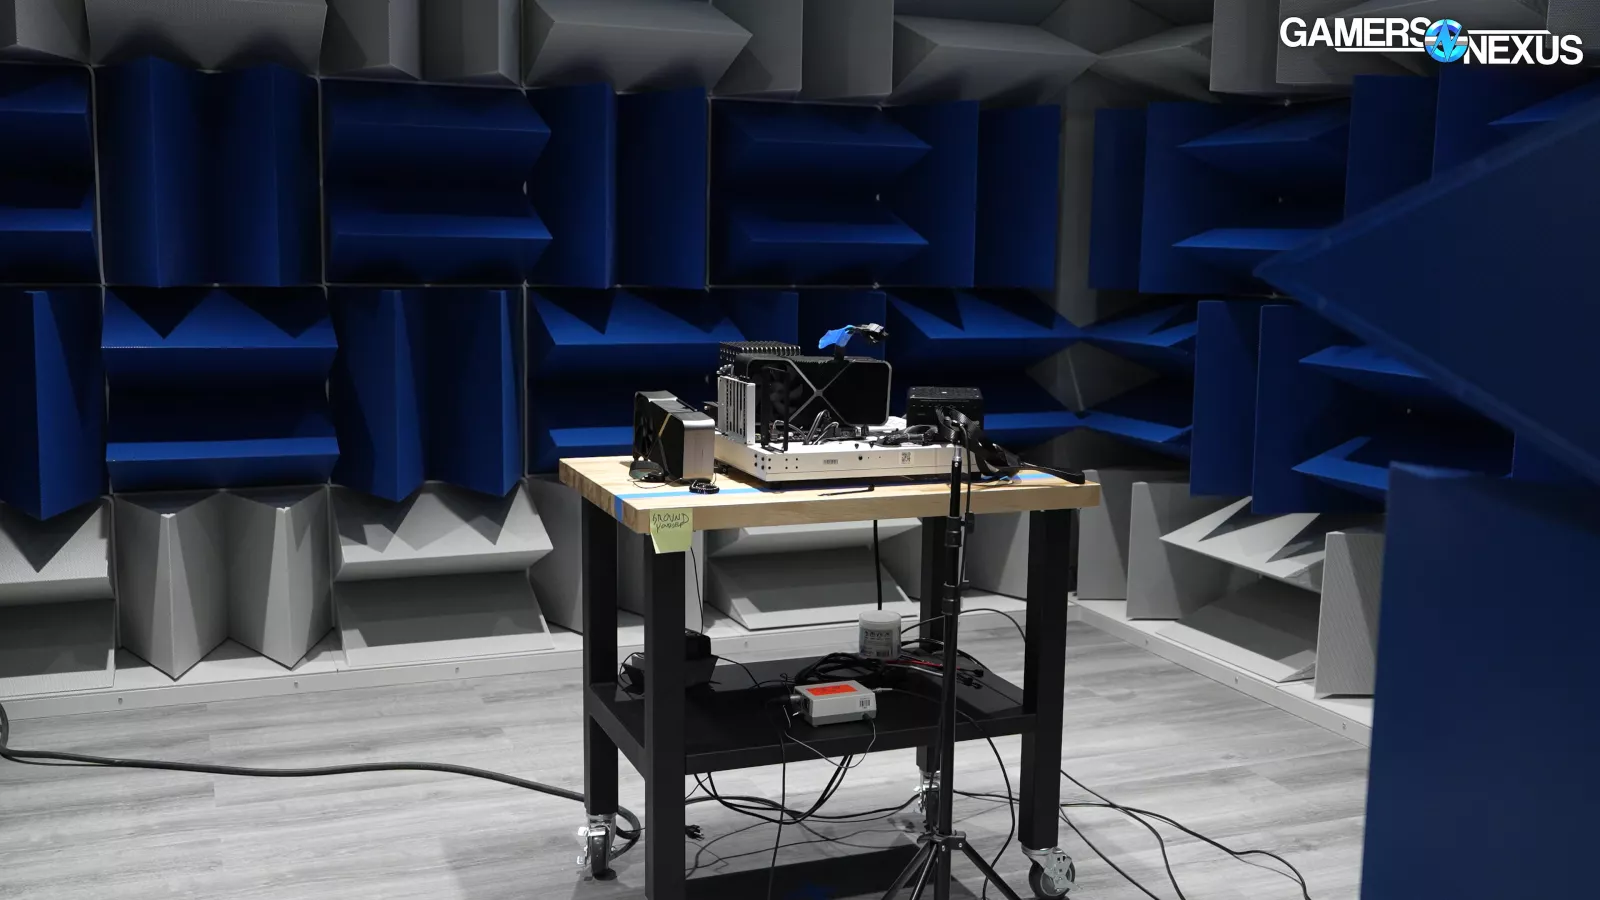
We took the RTX 5090 to our hemi-anechoic sound chamber to evaluate it. A good GPU temperature is an achievement at this size, but that can almost always be done by just blasting the fan speeds and compromising on noise levels.
We ran the card at the default fan RPM that the card set itself to at steady state under our standard thermal workload.
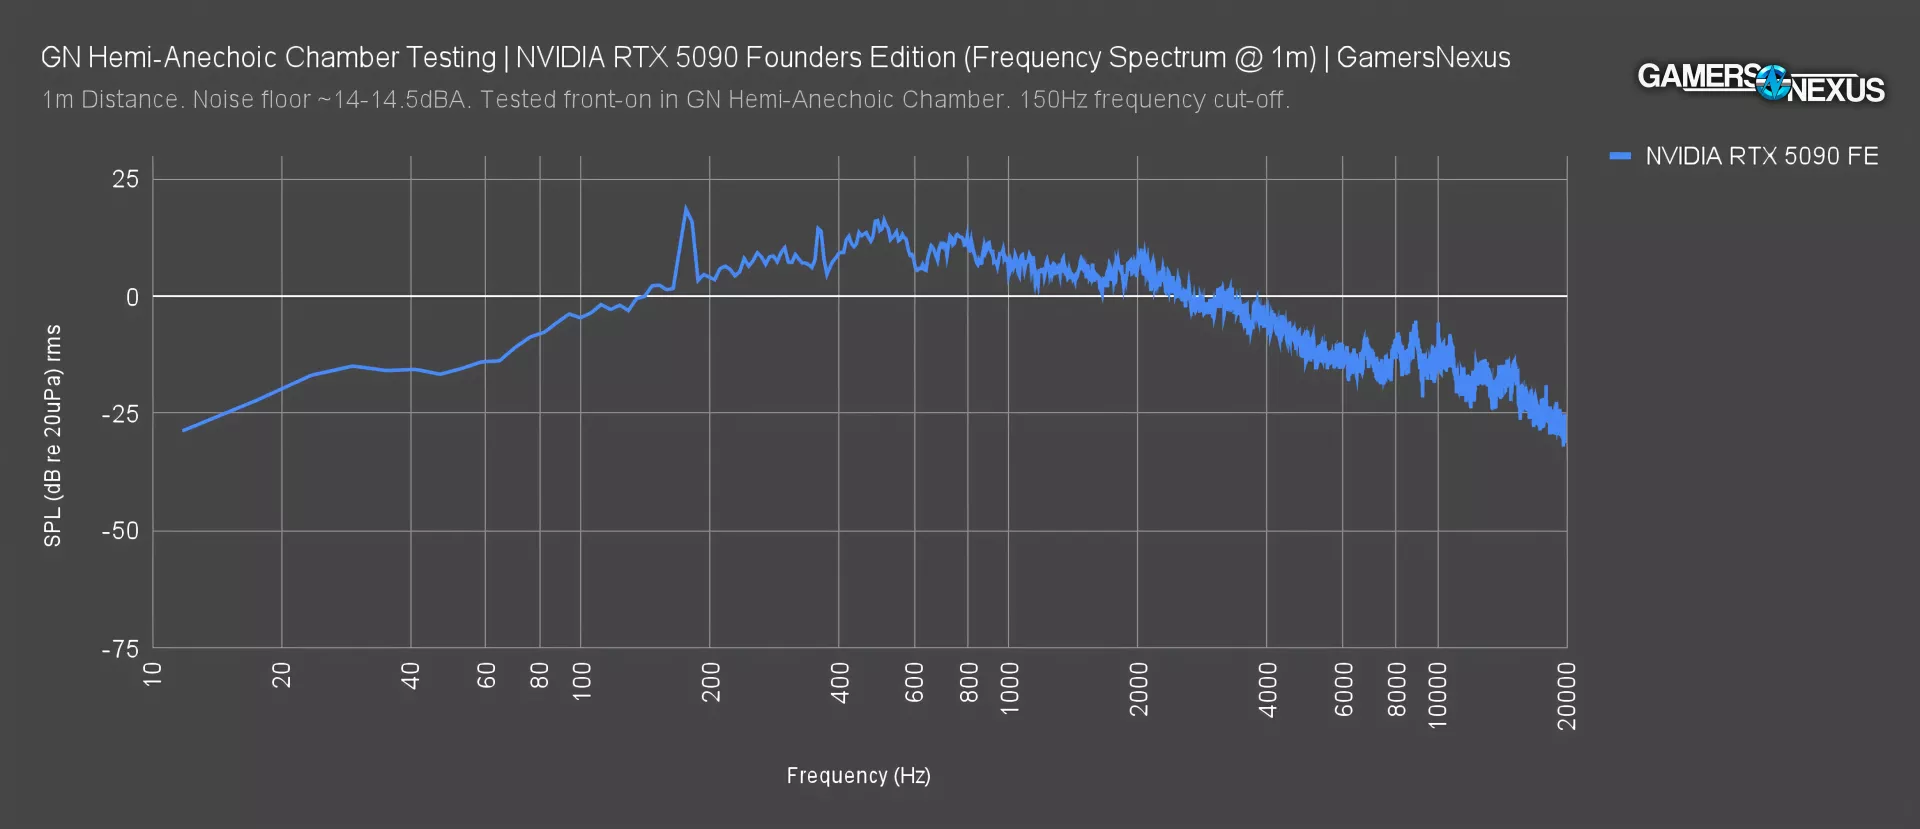
Here’s the frequency spectrum plot. In our acoustic chamber with a noise floor of about 14-14.5 dBA on the day of testing, the RTX 5090 was measured in our passive test bench at about 32.5 dBA total. That’s at a distance of 1 meter.
The RTX 5090 had some spikes during testing, including above our frequency cutoff, but overall has a very gradual curve for the plot. The limited presence of peaks and spikes in this plot help illustrate the relative uniformity of the whirring noise, which we subjectively think helps it blend into the background more. Noise is subjective, so although this plot objectively tells us that there’s a ping at 350 Hz and a bump in the plot around 515 Hz and again around 2,000 Hz, what matters is how it sounds.
This is a sound sample for you to judge on your own. Note that this is not identical to what we’re presenting as we have boosted it for purposes of being level with our video audio. Listen for the type of noise, not the volume.
Schlieren Imaging of RTX 5090
In our interview with Malcolm Gutenberg, he explained that the 5090’s thermal solution was designed to reduce recirculation using angled covers, which direct airflow.
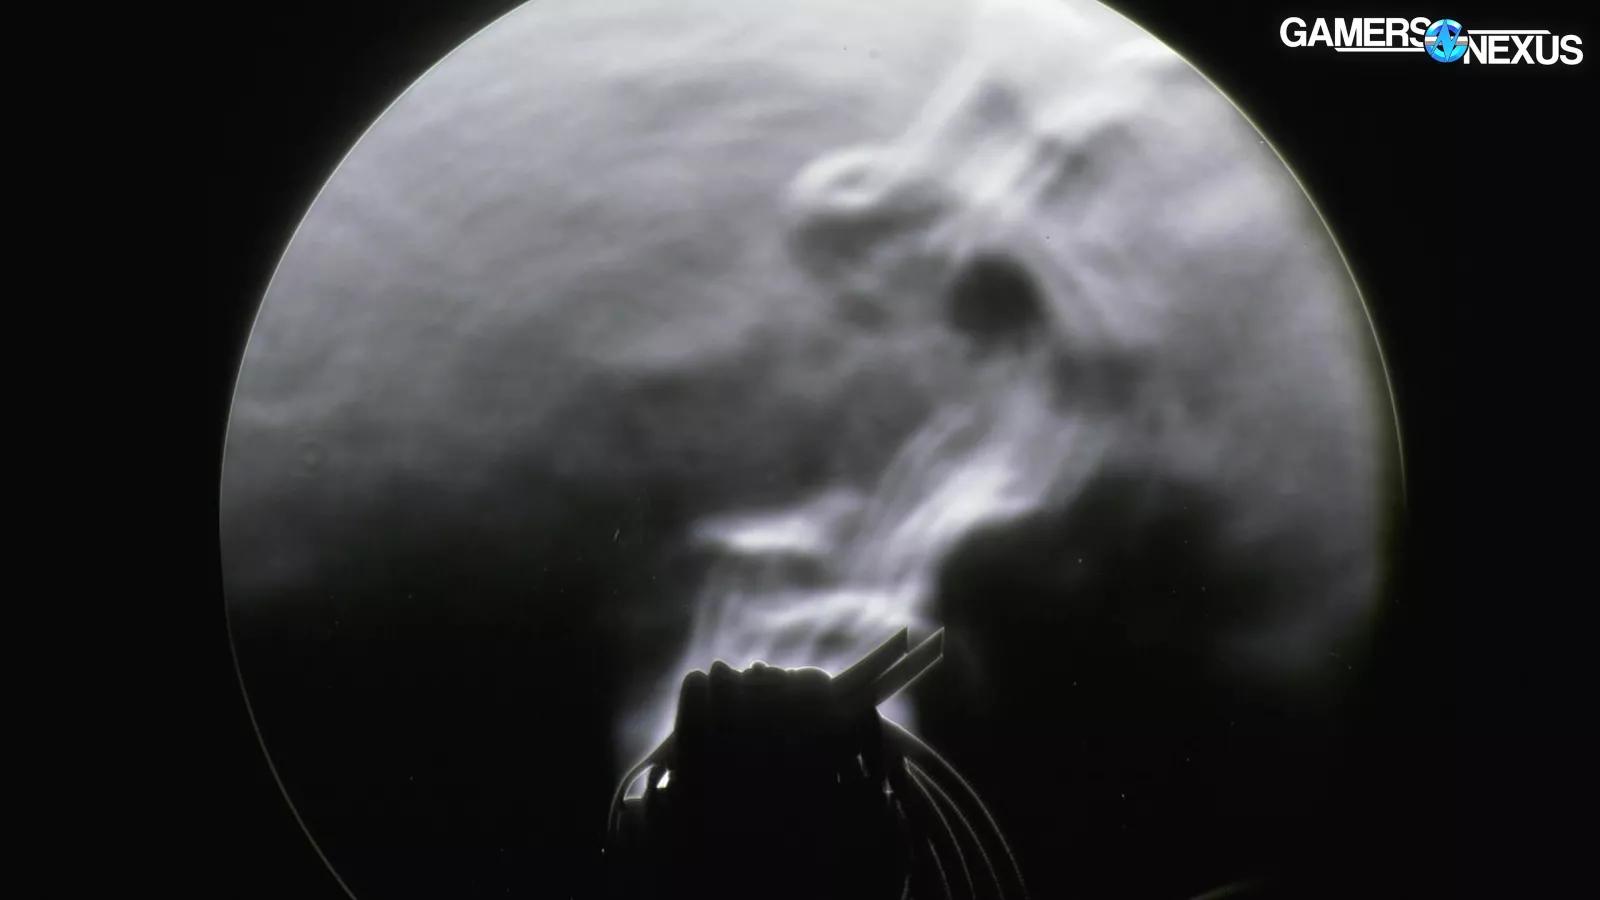
In this image, we’re looking at the GPU straight-on, with it perpendicular to the camera frustum. This is when the fans are off but the heat load has already started. You can see the density change as the hot air leaves the card passively.
As the fans turn on, we see a sudden flare-up and movement of air to the right through the flow-through area out the back and toward the CPU tower. What’s super cool here is that we can see the air kick up and out to the right at a 20-30 degree angle or so. We also see a really high flow area of air exiting from the fins at the outer edges of the heatsink design. This hyper focuses the flow and reduces recirculation around the front area of the card, which just means the whole design is incredibly efficient at getting air away from the board and into case exhaust fans.
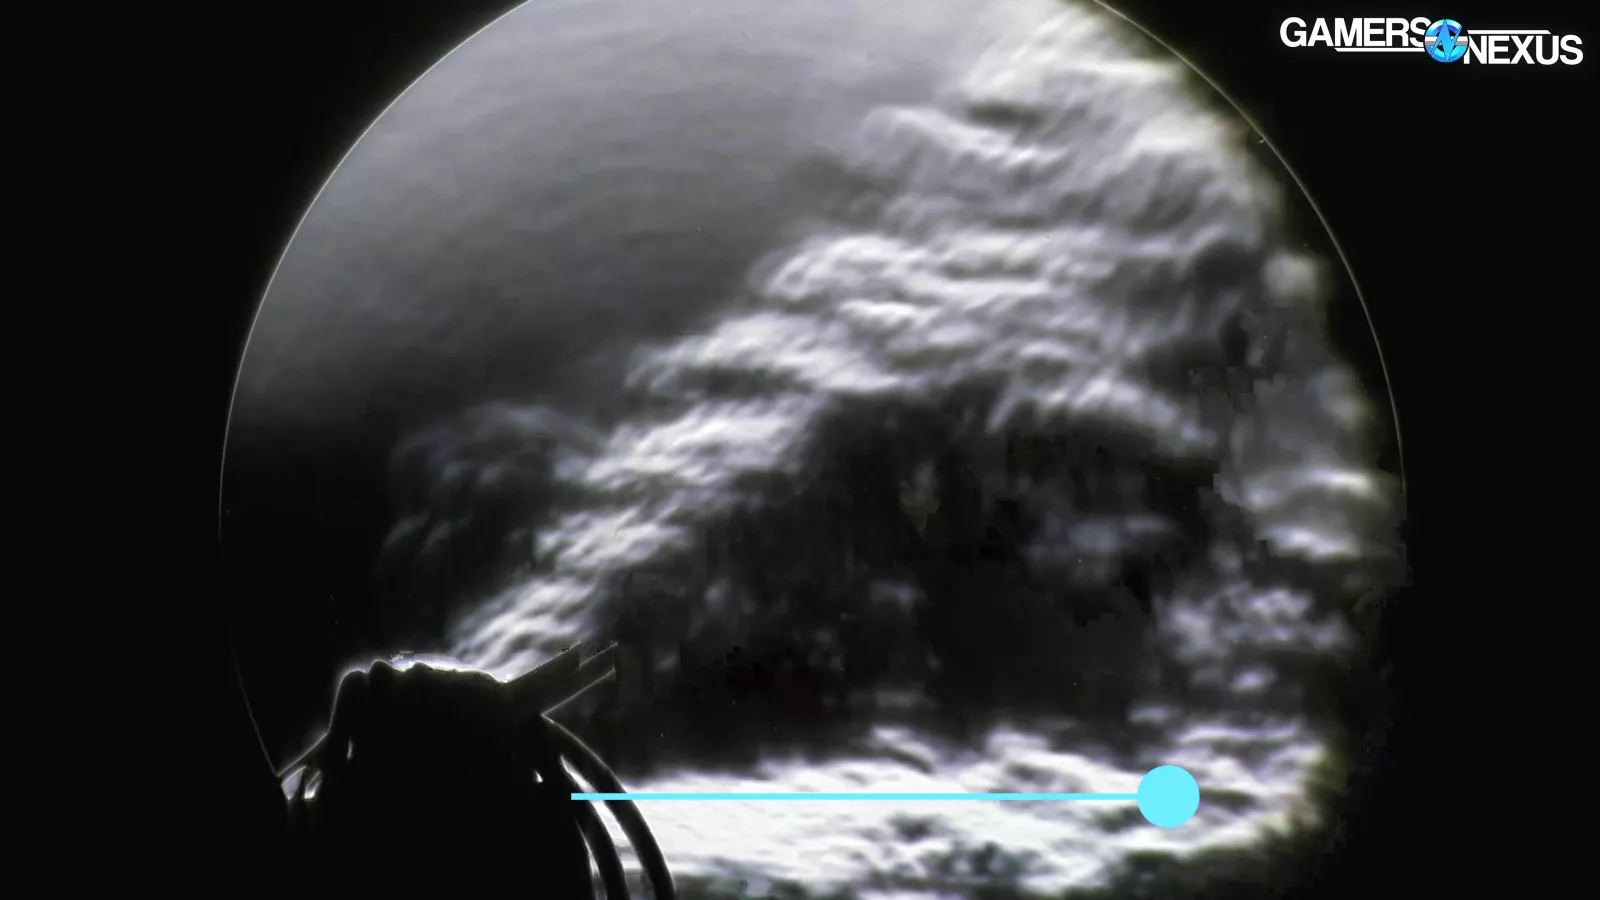
Here’s the table shifted to see more exhaust. The flow-through area has super high speed exhaust, illustrating why flow-through is so much more effective than shoving air straight into a PCB wall.
Looking at the fans spinning down at the end of a load and returning to passive cooling. Everything drifts up and away.
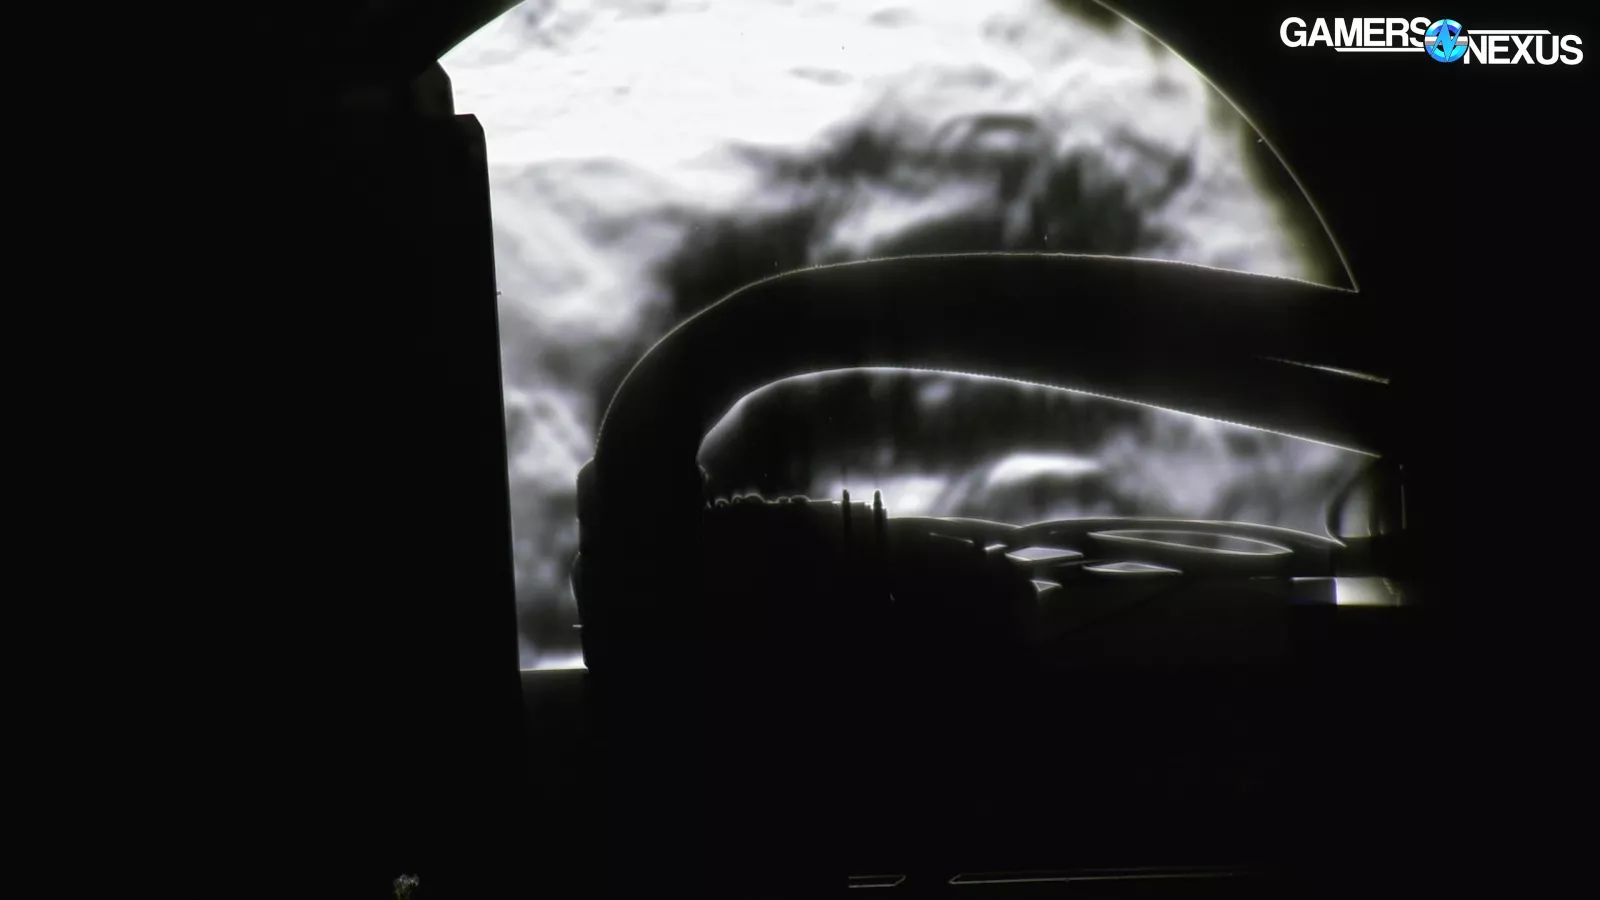
This next angle shows the card on the left and centered. The most interesting thing we see is this straight line of air shot out from those fins at the outer edges of the fan diameter. This is what Gutenberg was talking about in our interview, where they’re capitalizing on the area of most efficacy for the fan blade.
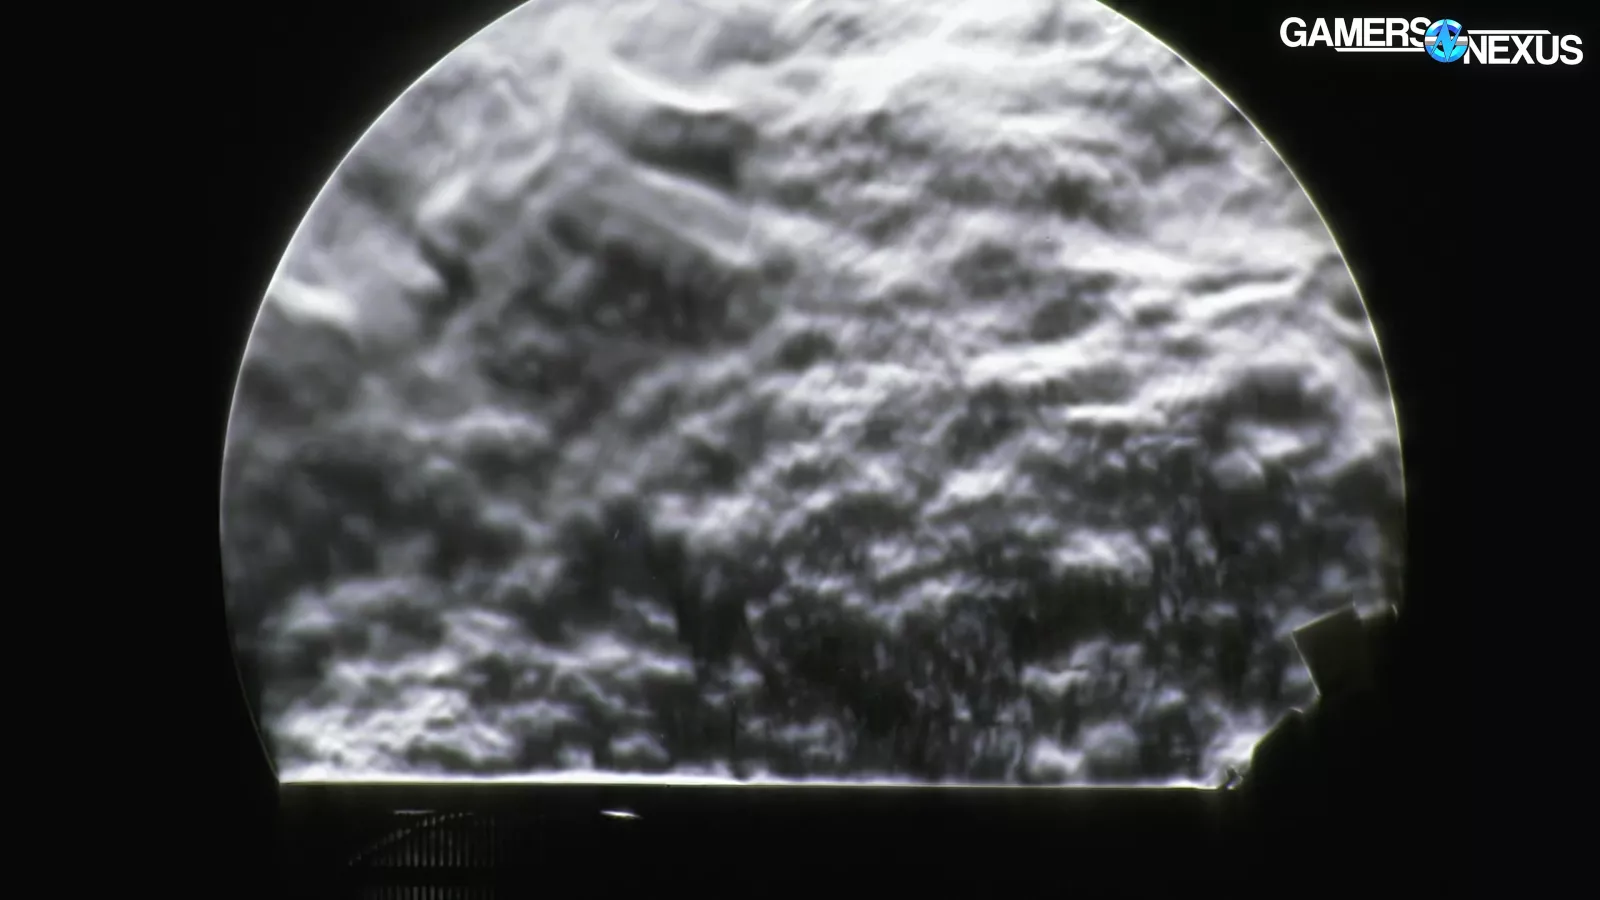
Finally, here’s the card straight-on, where we can see the amount of air shot up and out. You’ll want to choose cases with some spacing between the glass panel and the card to help get the warmed air away faster.
RTX 5090 Frequency
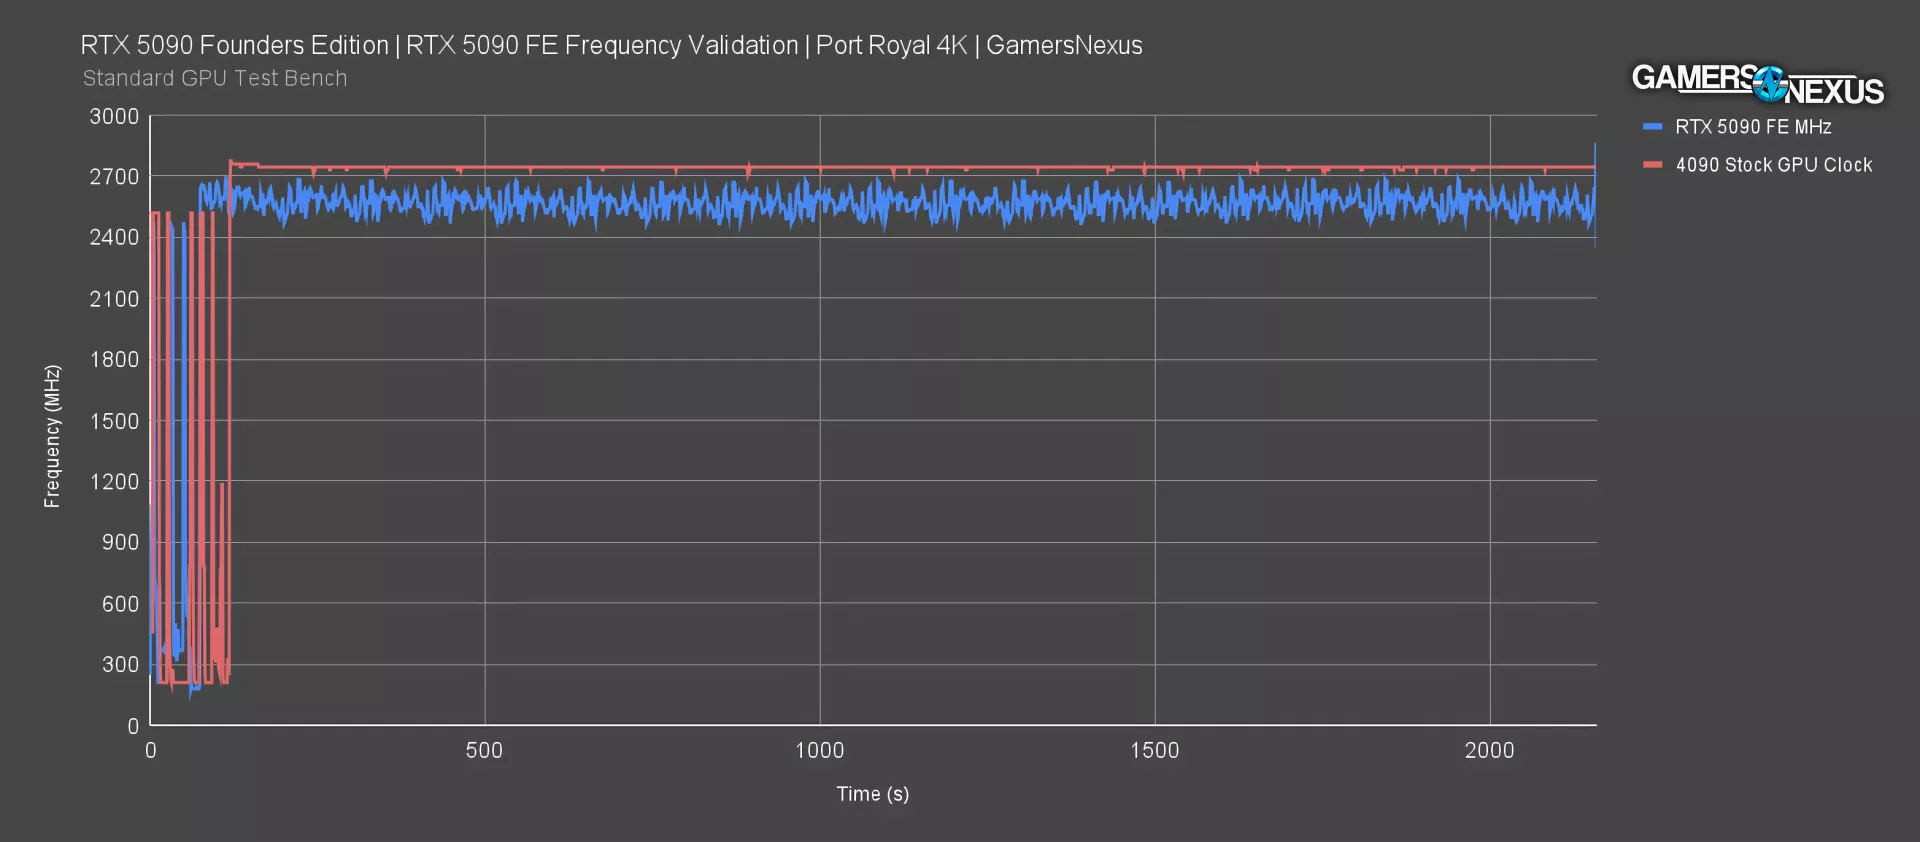
This next line plot is to ensure the GPU is functioning properly and meets the spec NVIDIA publicly claims. NVIDIA claims the 5090 runs at 2.01 GHz base and 2.41 GHz boost, with room for that to change based on the load. Assuming the software monitoring is correct for this new architecture, we measured about 2600-2700 MHz during the test, commonly 2600-2650 MHz.
The RTX 4090 ran at about 2745 MHz in the same benchmark back when it launched and we tested it. Frequency clearly isn’t everything though, and it’s common that higher end configurations bring frequency down in some capacity. It’s also true that architectural differences also make frequency indirectly comparable.
Ultimately: The card is exceeding the specification advertised by NVIDIA, so it’s running as expected, which is good.
RTX 5090 Game Benchmarks
Let’s get into gaming benchmarks.
FFXIV 4K

In Final Fantasy 14 at 4K, the RTX 5090 ran at a comically high 182 FPS AVG, with 1% lows that were nearly identical to the average framerate of the RTX 4090. That makes it 31% higher average framerate than the RTX 4090.
For a quick value discussion: The RTX 5090 is supposed to be $2,000, with the RTX 4090’s MSRP previously being $1,600. The 4090 is not commonly available anymore for a reasonable price, though. MSRP-to-MSRP, the 5090 is 25% more expensive and 31% higher framerate in this test. The memory capacity increase benefit isn’t seen in this game either, as that’d be more of an impact in professional applications like Premiere, 3D work, or ML workloads.
The RX 7900 XTX ran at 104 FPS AVG, the same as when we tested it in December (so there’s been no change), which gives the RTX 5090 a lead in this rasterized benchmark of 74%. The 0.1% lows are about the same between all of these devices at the top-end, which mostly comes down to pacing within the game.
Prior NVIDIA flagships include the RTX 3090 Ti (watch our review) at 88 FPS AVG, meaning that the 5090 has doubled that performance. The frametime pacing was excellent on the 3090 Ti as it closely follows the average. The 3090 (watch our review) was more or less a flagship as well and at 77 FPS AVG. The 6950 XT (watch our review) was also once a flagship, closer to the RTX 3080 (watch our review) for performance.
The RTX 2080 Ti (watch our review) held a 54 FPS AVG, meaning 5090 owners would see an increase of 237% over the 2080 Ti.
FFXIV 1440p

At 1440p, the 5090 again continues the comically high framerate by running at 317 FPS AVG. This has it about 17% ahead of the RTX 4090’s 272 FPS AVG. The advantage has been trimmed here, which could be because of an encroaching CPU bottleneck and/or because of architectural changes — 1080p will help answer that below.
For games like this, you’d need a high-end CPU and ideally more intensive resolution to really get full use of the 5090.
Since we’re bottlenecked, we’ll move along but quickly stop to look at 1080p — just for fun.
FFXIV 1080p

If you thought the previous framerate was funny, cast your sights upon 407 FPS AVG at 1080p. Sorry — that’s 407.1 FPS AVG.
Whew. Close one. As we all know, 407 FPS AVG is below the threshold of acceptability for the modern gamer. That 0.1 FPS is critical and is what finally pushes NVIDIA into playable territory for this game.
In serious news: The RTX 4090 at 376 FPS AVG means the 5090 is still about 8% ahead. This test really is just for fun though, but is a good reminder of the limitations of even a 9800X3D to boost the ceiling.
Black Myth: Wukong – 4K

Black Myth: Wukong is relatively new to our test suite and is tested using the built-in benchmark. We benchmarked it at 4K for this. Currently, we consider this test in our suite to be “experimental,” meaning our confidence in it is present, but lower than other tests as we evaluate its reliability. We have been moving toward removing experimental status from it with each review.
At 4K and where we’ve only tested a handful of cards due to the intensive load, the RTX 5090 ran at 86 FPS AVG with lows at 74 and 70. This has it 28% higher in average framerate than the 67 FPS AVG of the RTX 4090. So far, we’re seeing a few titles around this 30% number at 4K. Comically, the 1% lows, which for us is an average of the slowest 1% of frames, are higher than the average framerate for any other card on this chart; in fact, even the RTX 5090’s slowest 0.1% of frames are faster than the average framerate of the RTX 4090. That’s crazy.
The 7900 XTX’s 49 FPS AVG gives the 5090 a 74% lead, with the 3090 Ti giving it an 89% lead. Improvement over the 2080 Ti is enough to feel irrelevant as a percentage, as it takes it from totally unplayable to relatively fluid.
Black Myth: Wukong – 1440p

At 1440p, Black Myth has the RTX 5090 at 130 FPS AVG, 23% improved over the RTX 4090’s 106 FPS AVG. The lows also improve. The rapid rundown against other flagships is as follows:
The 5090 has a 51% higher average framerate than the 7900 XTX, 75% higher than the 3090 Ti FTW3 (RIP EVGA), 99% higher than the RTX 3090 Master, and 189% higher than the RTX 2080 Ti former flagship.
Black Myth: Wukong – 1080p

Black Myth Wukong is heavy enough that 1080p still has some meaningful spacing, even without ray tracing. The RTX 5090 ran at 160 FPS AVG, with good frametime pacing establishing 127 FPS and 116 FPS lows. The 160 FPS result has it 20% ahead of the RTX 4090, diminishing the earlier lead (which was 28% at 4K, 23% at 1440p, and now 20%). This isn’t just a CPU limit, as we also saw in Final Fantasy, but speaks to other advantages on the 5090 especially at higher resolutions. We think the memory bandwidth is likely a large part of that additional scaling.
The RX 7900 XTX ended up 113 FPS AVG, with the 3090 Ti former flagship at 94 FPS and the 2080 Ti at 62 FPS.
Starfield – 4K

Starfield is up next. We haven’t run that many cards for this at 4K, but have a lot of 1440p data. We’ll start with the more limited 4K data set.
At 4K, the RTX 5090 held 108 FPS AVG with lows that were within expectations for this game. The RTX 4090 ran 92 FPS AVG, giving the 5090 a lead of just 17%, lower than we’ve seen in some other tests.
The lead over the 7900 XTX’s 77 FPS AVG is 40%, with the lead over the 58.3 result for the 3090 Ti at 85%. The 3080 (watch our review) was down at 48 FPS AVG, with the 2080 Ti at 33 FPS AVG. AMD’s 7900 XTX and 7900 XT (read our revisit) are its highest-end cards available for the company right now, but the 6950 XT was a good deal in the back half of its life.
Starfield – 1440p

At 1440p, the RTX 5090 ran at 147 FPS AVG against the 132 FPS AVG of the RTX 4090. This is down to a 12% uplift. The 7900 XTX ran at 112 FPS AVG, a big improvement from its 4K result as you would expect, with the 4080 FE (watch our review) at 108 FPS AVG. The 4080 Super (read our review) would be around 1-3% better here if we had retested it.
Starfield – 1080p

There aren’t many reasons you’d play this game at 1080p with an RTX 5090, but just for sake of data: The 5090 ran at 165 FPS AVG here, with the 4090 at 155 FPS AVG. Although technically better for the 5090, we’re effectively at the CPU limit here.
Dragon’s Dogma 2 – 4K

Dragon’s Dogma 2 is up next. This is another new one that we added in 2024 and has been heavy on GPUs and CPUs alike depending on the test area.
In this limited suite of cards, we have the RTX 5090 at 133 FPS AVG, leading the RTX 4090 by 35%. This is one of the largest gains we saw in our test suite. The lows and 0.1% lows also scaled up, showing that frametime pacing wasn’t at the expense of higher FPS.
The RX 7900 XTX ran at 77 FPS AVG, with the 4080 FE at 72 FPS. Again, the 4080 Super would be about 1-3% above that.
The 2080 Ti from 2018 ran at 36 FPS AVG, and that’s without RT. The improvement to the 5090 is 267%. Climbing the flagships, the 3090 Ti’s 64 FPS AVG ends up giving the 5090 a 108% lead.
Dragon’s Dogma 2 – 1440p

At 1440p, the RTX 5090 FE climbs in framerate to 189 FPS AVG, with extremely well-paced frametime consistency shown in the high 0.1% and 1% low values.
The 5090 ends up leading the 4090’s 156 FPS AVG by 21% and the 7900 XTX by 50%. The lead against these cards has fallen from the 4K results.
Dragon’s Dogma 2 – 1080p

Although we’re in territory where it’s not meaningful for the experience, it’d help us to understand the behavior by looking at 1080p. The framerate still increases, so we weren’t totally bound by the CPU. The 5090 hits 214 FPS AVG, leading the 4090 by 13%. What’s interesting is that the 4090 is now at the same framerate that the 5090 had when the 5090 was at 1440p.
Cyberpunk 2077: Phantom Liberty – 4K

Cyberpunk is up now. We’re testing the Phantom Liberty expansion in-game in the expansion area.
The RTX 5090 ran at 95 FPS AVG, with lows at an impressive 81 FPS 1% and 77 FPS 0.1%. These lows are excellent numbers and similar to what we saw in Black Myth: Wukong, where the 5090’s lows are outperforming the 4090’s average. The improvement in average FPS was large at 50%, moving from 64 FPS AVG on the RTX 4090. This is the biggest gain we’ve come across so far. Cyberpunk is very particular though and sensitive to areas of the game. Checking with Wendell, his Level1 Techs team saw similarly huge uplift.
The RTX 4090 had a large 32% lead over the RTX 4080 already. As for the older cards, the 5090 and 3090 Ti are in entirely different classes. The 2080 Ti is down at 27 FPS AVG and struggling to run, although to its credit, its frametime pacing in relation to the average is excellent — it’s just that the framerate is low.
Cyberpunk 2077: Phantom Liberty – 1440p

At 1440p, the RTX 5090 ran at 181 FPS AVG, with lows at 126 and 108. The RTX 4090 held a 137 FPS AVG, with the advantage of the 5090 being reduced to a still respectable but lower 33%. The 7900 XTX ran at 120 FPS AVG here, which has remained a good result considering the price of the 7900 XTX as compared to its neighbors. That story is totally different with RT, though.
The RTX 3090 Ti ran at 91 FPS AVG, with the 2080 Ti at 57 FPS AVG.
We were fully CPU bound at 1080p, so we’ll skip it.
Dying Light 2 – 4K

Dying Light 2 at 4K is another heavy load for these GPUs. The RTX 5090 shows a familiar scenario of the 1% lows and 0.1% lows, which represent the slowest frames in our test passes, outperforming the average framerate of the RTX 4090. NVIDIA has managed to move the needle for at least the flagships, which we think is partly thanks to cache and memory configuration changes.
The 5090 leads the 4090 by 38%, another impressive jaunt not distant from what we saw with Phantom Liberty. The 7900 XTX did OK in this test as compared to the 4080. The 5090 runs 74% higher average framerate than the 7900 XTX and also costs about 127% more, depending on what price the XTX is. For professional users though, the memory benefit isn’t accounted for in almost any gaming scenarios we test and would be in other applications.
Dying Light 2 – 1440p

At 1440p, the RTX 5090 holds a 216 FPS AVG against the 4090’s 173. This has the 5090 25% ahead of the RTX 4090, down from its lead of 38% at 4K. We won’t burn chart time on it, but 1080p is only about 15 FPS higher, so part of this reduction in scaling is because we’re starting to approach the CPU limit.
Resident Evil 4 – 4K

Resident Evil 4 is up next, first rasterized and at 4K.
The RTX 5090 landed at 207 FPS AVG here, with lows running higher as a result of consistent frame pacing. The end result is a lead over the 151 FPS AVG of the 4090 by 37%, a lead over the 7900 XTX of 64%, and lead over the 4080 of 101%. Against prior flagships, the 3090 Ti landed at 89 FPS AVG, giving the 5090 an uplift of 133%.
Resident Evil 4 – 1440p

At 1440p, the RTX 5090 continued scaling and hit almost 350 FPS AVG, with lows that are at ridiculous levels with 281 FPS 1%. This puts the 5090’s average framerate 25% ahead of the 4090’s average framerate, so we’re seeing a reduction from the 37% at 4K, consistent with what we’ve seen elsewhere.
The 7900 XTX held on at 232 FPS AVG here, followed by cards like the 3090 Ti at 162 FPS and 2080 Ti at 92 FPS AVG.
Resident Evil 4 – 1080p

At 1080p, we see there was still scaling all the way up to almost 400 FPS AVG, which is crazy. This has reset our expectations of where the CPU ceiling is. If anything, this is showing just how good the 9800X3D is for keeping up so well.
The gap between the 5090 and 4090 is around 9% here, so we are actually hitting external limits.
RTX 5090 Ray Tracing Benchmarks

And now we’re moving to ray tracing benchmarking. This contains games like Black Myth and Cyberpunk, which tend to favor NVIDIA, and games like Resident Evil, Dying Light, and Dragon’s Dogma, which give some more variety.
Ray Tracing – Black Myth: Wukong 4K

Black Myth is first. This is an experimental chart, so once again, our disclosure is that experimental charts have a greater risk of unexpected results as we are still researching its behaviors. This particular title is considered experimental in our test suite because its performance leans so heavily in one direction that we want to slowly accumulate results to explore it further.
The 5090 ran at 88 FPS AVG at 4K, outperforming the RTX 4090’s 65 FPS AVG result by 36%. That’s a big jump. This is with upscaling, so it’s not like-for-like with the 4K raster results.
AMD’s 7900 XTX ran at 20 FPS in this title, which is why we say it’s NVIDIA-favored. The 3090 Ti ran at 34 FPS AVG here.
Ray Tracing – Black Myth: Wukong 1080p

Skipping 1440p and going to 1080p with FSR to get more cards on the chart, here’s where we land. The 5090 is at 158 FPS AVG here, leading the 4090’s 120 FPS AVG result by 31%. Against the 3090 Ti, the 5090 leads by 103%, and against the 2080 Ti’s 49 FPS AVG, it’s about a tripling.
The 4070 (watch our review) outperforms the 3090 Ti in this test when using FSR, with the entire top half of the cards outperforming the 7900 XTX. This test, again, is heavily favored for NVIDIA with the heavy ray tracing use.
Ray Tracing – Dragon’s Dogma 2 4K

Dragon’s Dogma 2 is up next. Again, we haven’t done a ton of 4K Ray Tracing tests here because it’s such a heavy workload normally, but the RTX 5090 ran at 113 FPS AVG with lows at 97 FPS and 94 FPS. The 4090 landed at around 85 FPS AVG, giving the 5090 an uplift of 33%. The RX 7900 XTX does better in this game compared to Black Myth, instead outperforming the RTX 4080 and 3090 Ti, the latter of which is at 55 FPS AVG.
Ray Tracing – Dragon’s Dogma 2 1440p

At 1440p, the 5090 jumped to 165 FPS AVG and the 4090 held 136 FPS AVG, still keeping about a 30 FPS gap between them, or an improvement generationally of 22%. The uplift has fallen as compared to 4K, keeping with prior trends. The 7900 XTX does similarly here to last time, landing just ahead of the RTX 4080 (watch our review).
Ray Tracing – Dragon’s Dogma 2 1080p

At 1080p, the 5090 continues to climb to 194 FPS AVG, reducing the generational uplift to 15% over the 4090. Let’s move on to something more interesting.
Ray Tracing – Dying Light 2 4K

Here’s Dying Light 2 ray-traced. Again, we haven’t historically run 4K here because only the 4090 and 4080 could be argued as capable. It looks like this next generation of hardware — and hopefully that also includes AMD’s next card — is changing that. The RTX 5090 ran at 109 FPS AVG, leading the 80 FPS result of the 4090 by 37%. The 7900 XTX is led by 137%. AMD has publicly claimed that its next generation will significantly improve upon this, so we’ll see where they land probably closer to March.
Ray Tracing – Dying Light 2 1440p

At 1440p, the RTX 5090 ran at 176 FPS AVG and held lows of 152 and 126. The 176 result has it about 40 FPS, or 29%, ahead of the RTX 4090. The 4080 hit 104 FPS AVG with the 3090 Ti at 88 FPS. Our 2080 Ti was approaching a decent framerate, but still falling short at 46 FPS AVG.
Ray Tracing – Dying Light 2 1080p

At 1080p, the 5090 held 224 FPS AVG, mostly establishing that we weren’t bound previously by the CPU. So when it was at 4K, the scaling was a 37% generational improvement, then 29% at 1440p, and now is 24.5% at 1080p. The reduction from 1440p to 1080p isn’t as big as we might expect from other tests, probably because there remains enough GPU load to where the CPU isn’t heavily taxed.
Ray Tracing – Resident Evil 4 4K

Resident Evil 4 with Ray Tracing is up now, tested at 4K first. The 5090 ran at 210 FPS AVG using FSR as defined in the chart title. The 160 FPS RTX 4090 result establishes a 31% generational improvement favoring the 5090.
The lead over the 7900 XTX is 56%, with the improvement on the 3090 Ti at 113%.
Ray Tracing – Resident Evil 4 1440p

We’ll keep this short: At 1440p, the RTX 5090’s lead falls to 23% over the 4090. This trend is consistent.
Ray Tracing – Cyberpunk 4K RT Ultra

Cyberpunk with RT Ultra at 4K is heavy even for the RTX 5090 when not using some form of upscaling, which we toggle off in testing specifically because of how unreliable Cyberpunk’s sticky settings are. The 53 FPS AVG puts the 5090 35% ahead of the 4090’s 39 FPS AVG result, remaining consistent with prior tests. The poor, old 2080 Ti nearly burst into flames trying to run this, holding an 8.8 FPS AVG as it crawled across the finish line.
Ray Tracing – Cyberpunk 4K RT Medium

4K with RT Medium is interesting. Dropping from Ultra to Medium predictably increased performance, but grew the gap between the cards with a 59 FPS AVG and 40 FPS AVG result.
RTX 5090 Efficiency Benchmarks
Now we’re getting into efficiency benchmarking and idle power consumption. For this, although we tested a lot of games, we’re going to simplify the charts and just look at a couple of game tests plus idle. These convey the whole story pretty well.
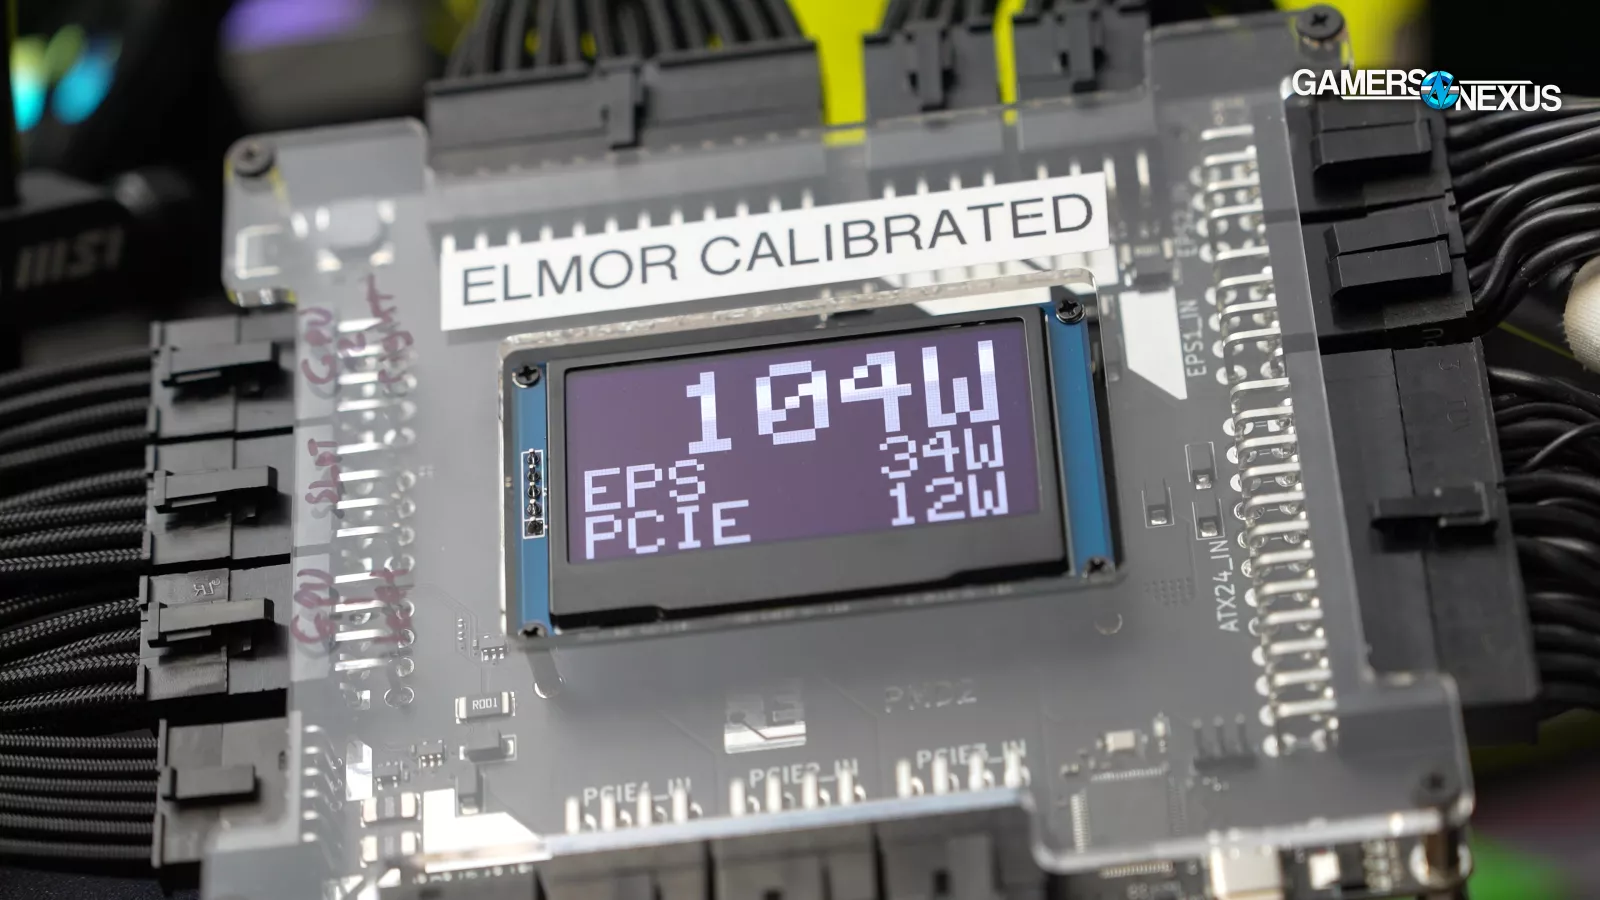
Testing is done by measuring the GPU power consumption at the PCIe cables and the PCIe slot with an interposer. Although we initially had trouble getting the card to work on the riser due to PCIe generation differences, in the final hours before going live, we found a solution to measure through the riser. This testing eliminates the remainder of system power consumption, so we’re isolating for just the GPU.
RTX 5090 Power Consumption: Idle

Testing idle power consumption, the RTX 5090 FE landed at 46W on the desktop with our benchmarking approach. The RTX 5090 FE measured lower in idle power draw than the Arc A580 (read our review) and about the same as the A750 (read our revisit). Even just sitting there, it’s drawing a good amount of power. Our testing uses Windows High Performance power plan for benchmarking performance, so switching to Balanced may help reduce this; however, we use that plan for all tests, so these are like-for-like comparable. We measured the RTX 4090 at 28-29W. The 5090 has relatively high idle power consumption with our test approach and this is an area where there’s clearly some room for improvement if only judging by the 4090, although the power consumption of the TDP is higher on this card.
Efficiency: FFXIV 4K

Final Fantasy 14 at 4K is low on results since we just started using this for efficiency for this launch. The RTX 4090 was the most efficient here, at 391.7 W to produce 138-139 FPS AVG. That puts it at 0.35 FPS/W. The RTX 5090 FE was efficient as compared to the other cards we’ve tested here, but technically worse off than the 4090. Realistically, they’re about the same. Despite framerate improving by 31%, the power consumption also increased by 37%. The end result is reduced or equal efficiency versus the last generation. This might be why NVIDIA is pushing the narrative so hard that MFG improves efficiency, except that’s like saying “why compare apples to apples when you can compare apples to oranges?”
In the very least, against the 3090 Ti in a like-for-like comparison, we can see clear and massive iterative improvements.
Efficiency: FFXIV 1440p

We’re showing 1440p to get a wider selection of cards, though the lighter load won’t look better for the 5090. The RTX 5090 ended up around 520W average for this work, landing it at 0.61 FPS/W. Efficiency is down comparatively overall since we saw the performance advantage also go down when at 1440p. The card should show the best gains in heavy 4K/RT workloads like F1.
Efficiency: F1 24 4K

Here’s F1 24 at 4K and with ray tracing.
On a technicality, the RTX 5090 is the most efficient in this test. It pulled 569W on average during testing and had spikes up to 580-590W, and because of the framerate advantage over the RTX 4090 with its 428W draw, it ends up at 0.21 FPS/W instead of 0.20. This isn’t particularly exciting and we have to highlight that NVIDIA’s claims of efficiency improvements largely centered around artificially generating frames, which isn’t like-for-like because the frame itself may not be the same or comparable.
RTX 5090 Conclusion

First of all, we need to start with NVIDIA’s complete bulls*** marketing. Unfortunately, NVIDIA just couldn’t help itself except to unfairly misrepresent its RTX 5090’s performance in the following slide on its site.
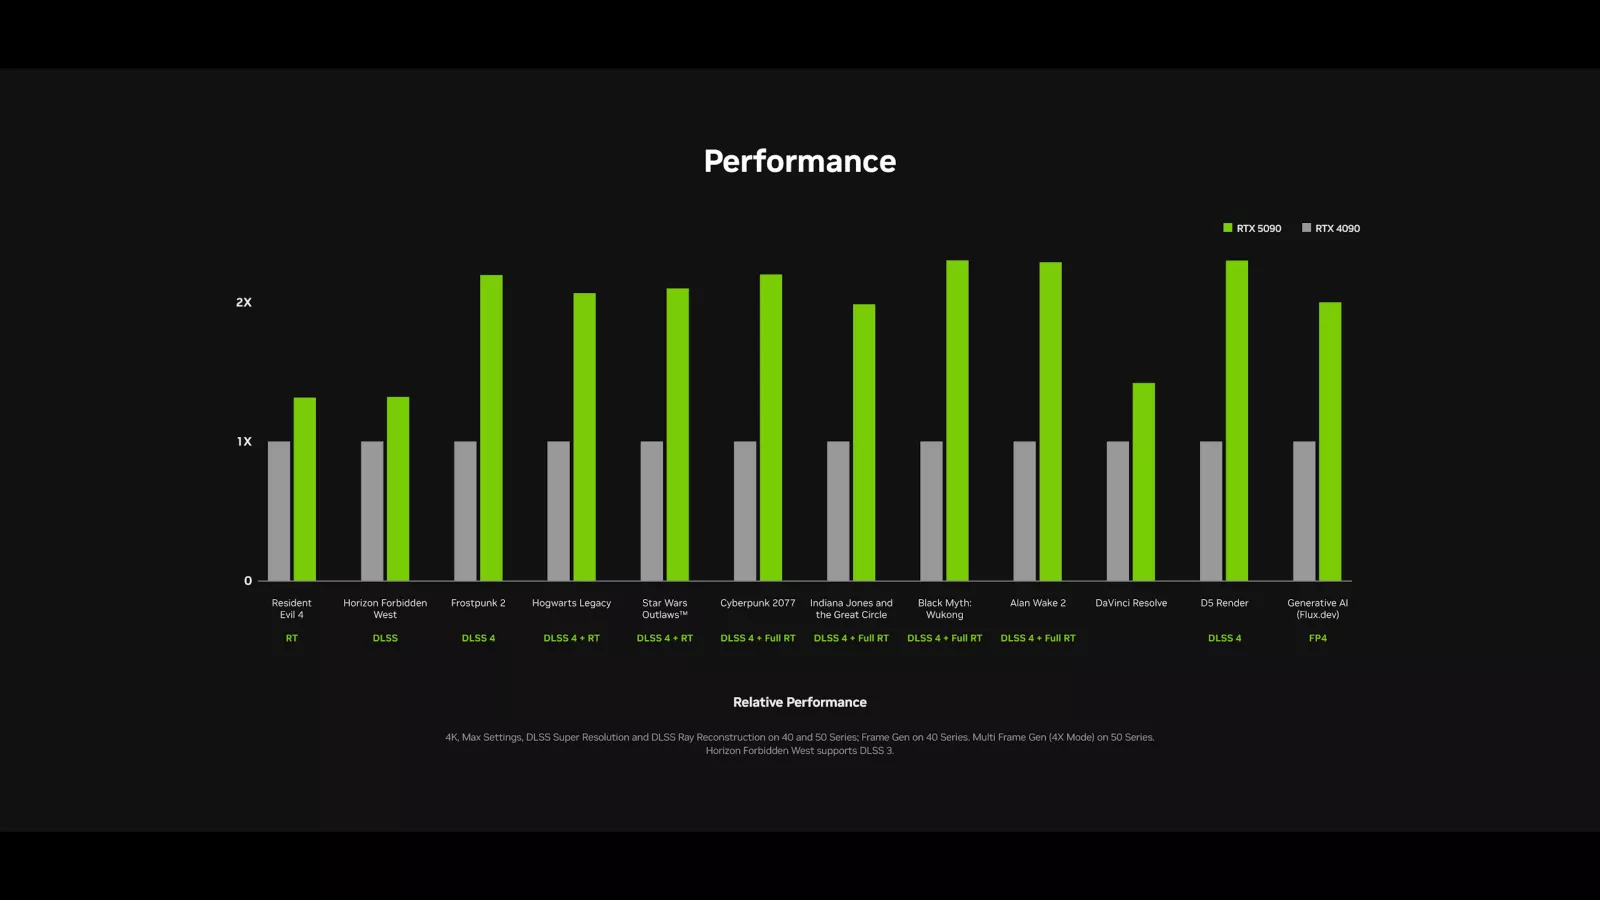
This image shows the RTX 5090 as being 2x faster than the RTX 4090 regularly, but as you all know from the review you just read, that’s not true. This image doesn’t say “different DLSS versions where we needlessly compare apples to oranges even though we have nothing to be shy of if we tested properly, it says “Performance.” And the accompanying caption isn’t even part of the image. Just saying “Performance” while making big 2x bars makes the 5090 look 2x better than the 4090. NVIDIA technically lists the DLSS version in the bottom, but most people don’t know what that means. Most people don’t know that writing “DLSS 4” under BOTH bars of the RTX 4090 and RTX 5090 isn’t actually the same setting. DLSS 4 does not do the same thing on both of these devices. NVIDIA’s own line of gray text that blends into the background at nearly the same color states the test configuration. This states that Frame Gen was used on the 40 series and 4X multi-frame gen was used on the 50 series, which isn’t like-for-like. NVIDIA is generating more artificial frames per real frame on the 5090 than the 4090, but they just list “DLSS 4” under the bars instead of making it clear.
NVIDIA didn’t have to do any of this, but between this insane reach of marketing and the claim CEO Jensen Huang made about an RTX 5070 performing the same as an RTX 4090, it comes across like NVIDIA feels like it isn’t good enough on its own. It has to put a bunch of makeup on the charts to be good enough.
Anyway, enough of the marketing bulls***. The recap is this:
- Know what kind of user you are. Users of VRAM-intensive professional applications should consider the 5090 heavily, but we don’t have data for you today. Maybe in the future. For gaming, anyone who isn’t playing on 4K or higher resolutions won’t get as much relative gain out of this card
- Generally, we saw 27-35% uplift in 4K gaming over the RTX 4090.
- In one instance, we saw 50%
- In one RT instance, we saw 44%
- Most of the time, it hung around 30%
- At 1440p, we saw those drop down into the 20s typically, even when not CPU bound
- The card is one of the most power hungry idle power consumers we’ve tested
- The card is the most power hungry for maximum power consumption and we worry that NVIDIA has elected to continue using 12VHPWR while pushing so close to the limit of the cable spec. We have a full video on the dumpster fire of 12VHPWR and 12v2x6 if you want to learn more
- Efficiency is about the same as the 4090
- Thermal design is excellent, with the FE card impressing us in big ways. That NVIDIA managed to make this 2 slots and still in the 70s while not being ridiculously loud is impressive, and they deserve every bit of credit for that
- As far as value, we’ll be able to more easily talk about that next week when we can review the RTX 5080. For now, NVIDIA is launching the 5090 first, which makes it hard for us to know how close the 5080 gets to the 5090. If the 5080 accomplishes most of the performance but reduces VRAM, that’d be important information for us to have before making a value statement on the 5090, so we’ll wait for now on that
We’ll have a lot more coming up.

